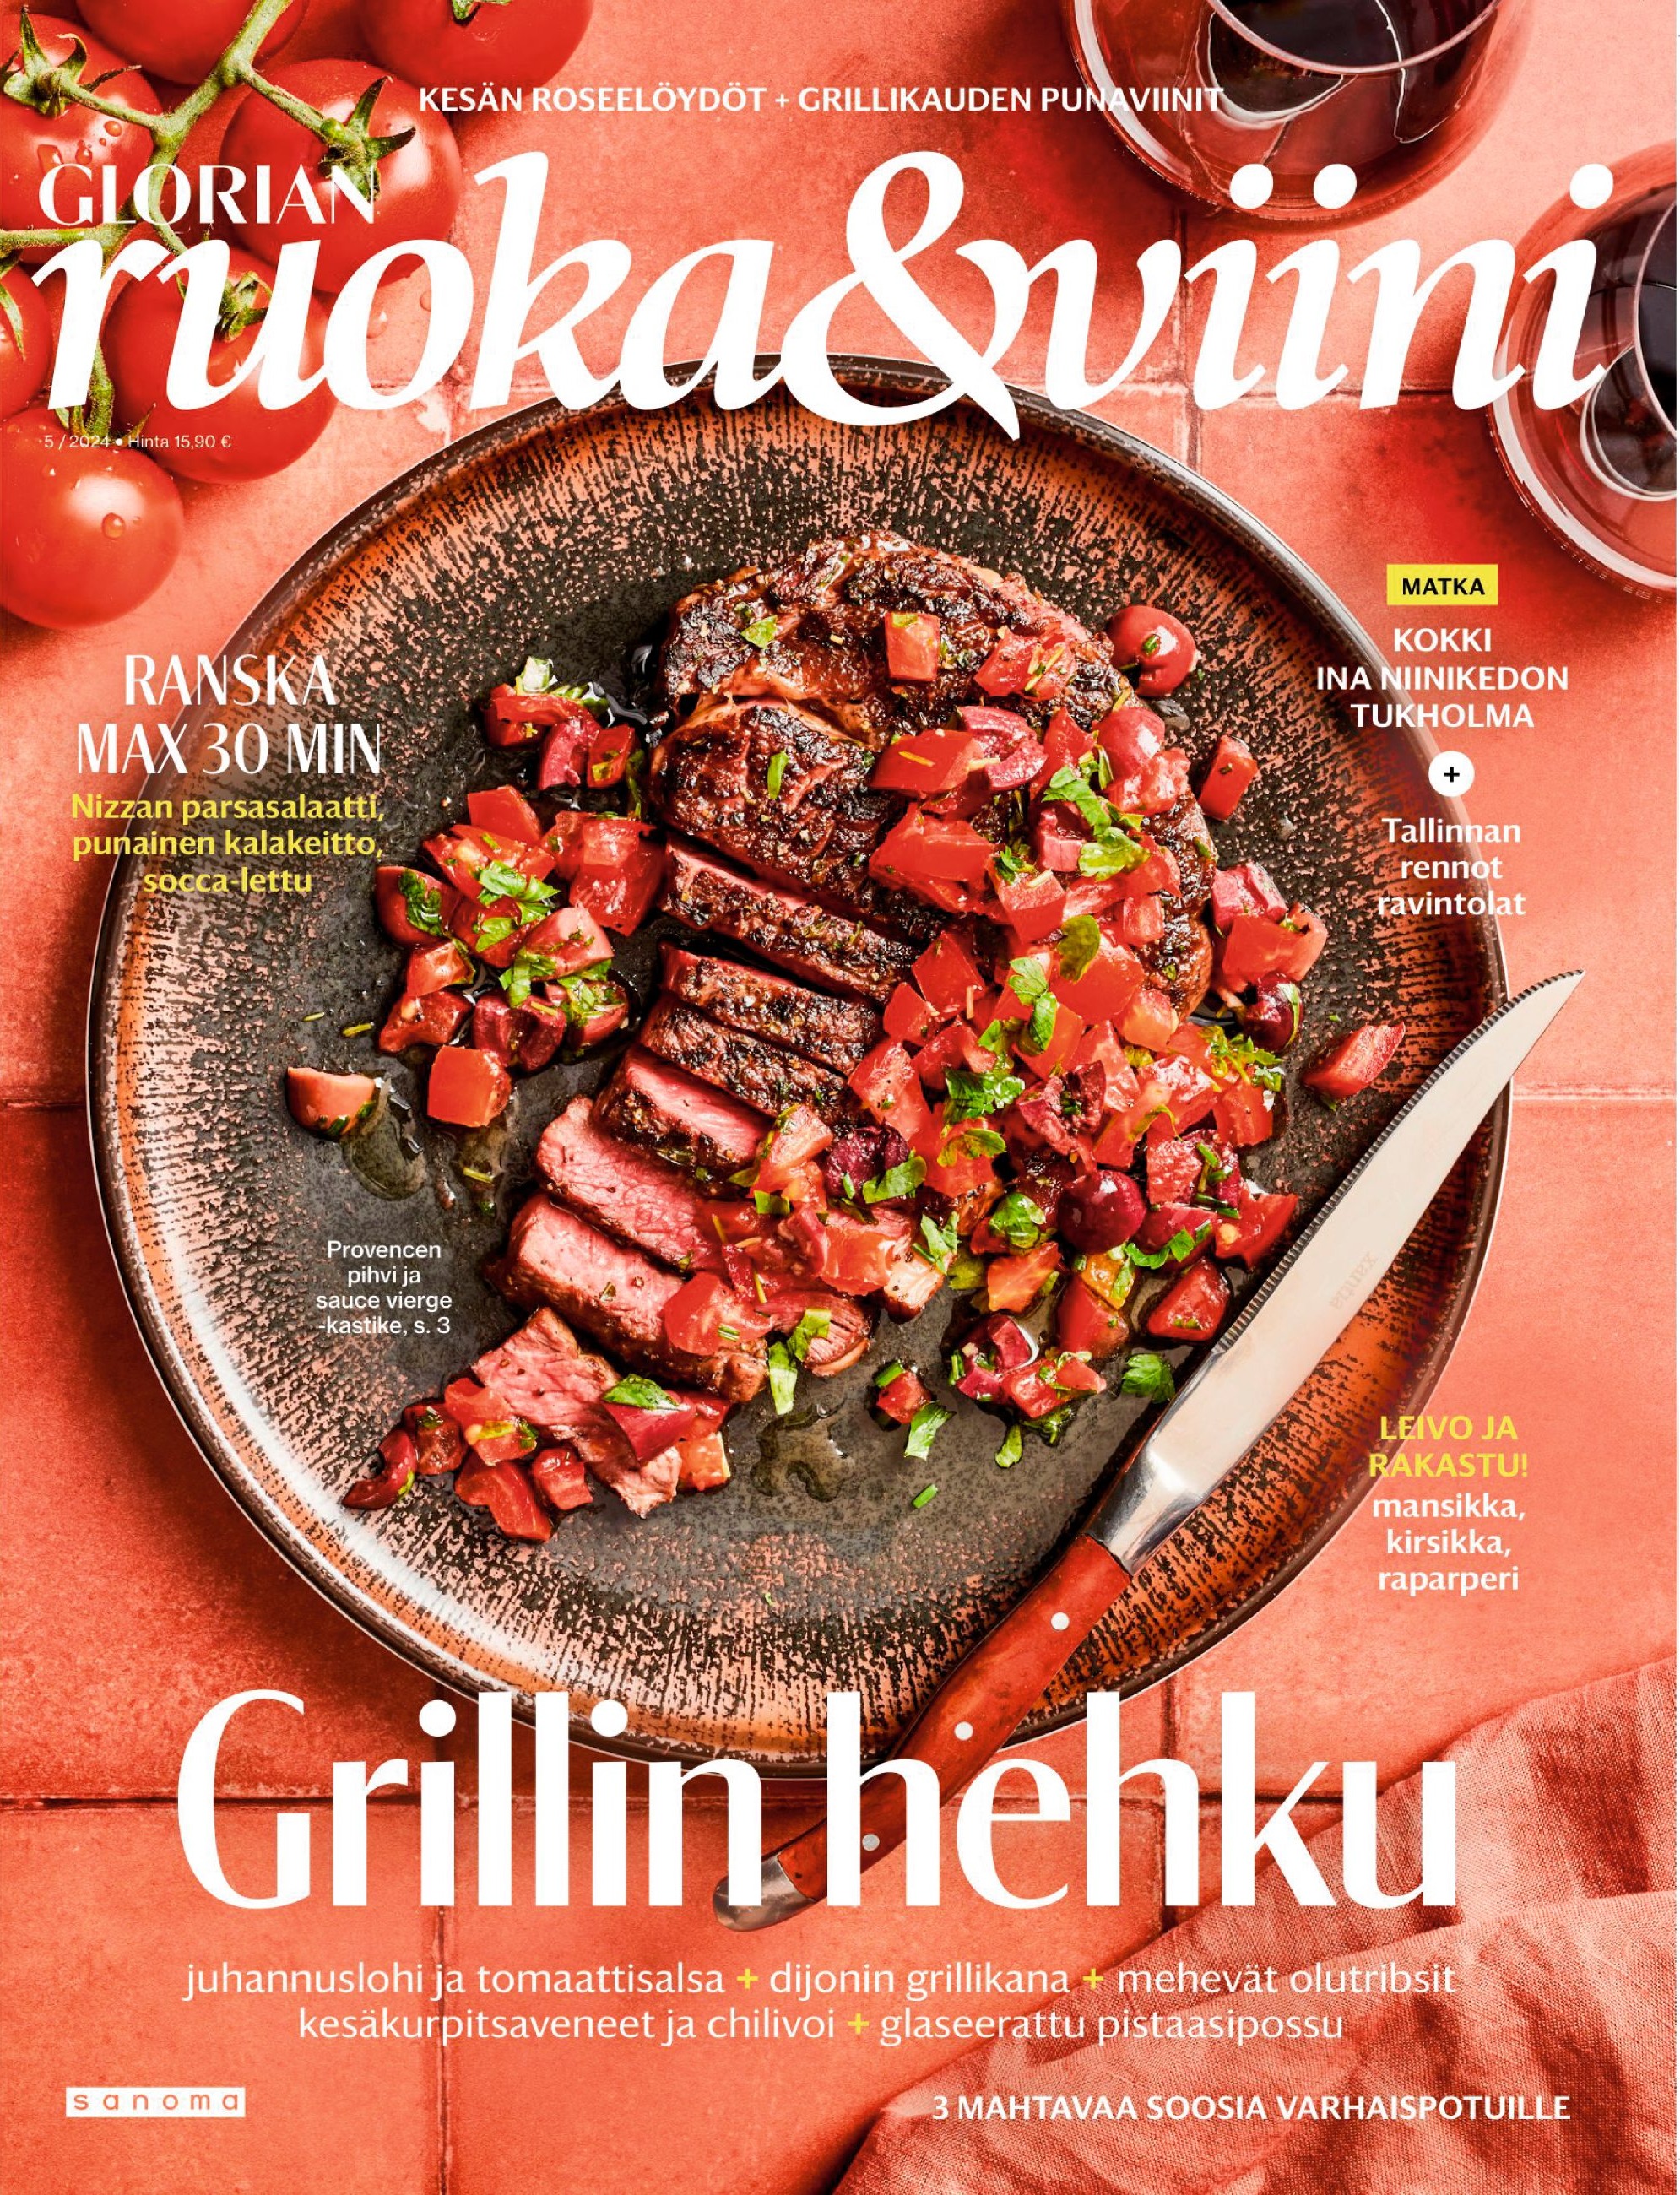
Glorian ruoka & viini
The biggest and most renowned food magazine in Finland celebrates the joys of good food. Glorian ruoka & viini offers good food for every day of the week – quick and tasty recipes for everyday life and slower flavours for the weekend. The magazine combines wine and food in a practical way by making drink recommendations for recipes, wine tips and practical information on combining wine and food. Glorian ruoka & viini tells you the best product, food travel and restaurant tips and presents the most interesting food phenomena from us and around the world. Readers of the magazine have high purchasing power and are curious, experimental foodies and heavy users of lifestyle. Glorian ruoka & viini is by far the best way to reach food influencers, i.e. food runners.
Issues per year
10 issues per year
Magazine website
Magazine in Social Media
Timetables
| Issue | Issue | Booking Date | Material Date | Themes and info |
|---|---|---|---|---|
| 1 | 2.1.2025 | 5.12.2024 | 10.12.2024 | Food and drink trends. India. Winter flavors of tofu. Low-alcohol wines. |
| 2 | 13.2.2025 | 23.1.2025 | 27.1.2025 | Big restaurant issue. New flavors for sandwiches. Hot noodles for the cold season. |
| 3 | 20.3.2025 | 27.2.2025 | 3.3.2025 | France on the plate and in the glass. Easter's main stars and wines. Chocolate. |
| 4 | 24.4.2025 | 1.4.2025 | 3.4.2025 | Spring celebrations. Modern baking classics. Quick bites & best seasonal drinks. |
| 5 | 28.5.2025 | 7.5.2025 | 9.5.2025 | Korean BBQ. Summer fish. Australian barbecue wines. Pancake parties around the world. Summer baking. |
| 6 | 3.7.2025 | 12.6.2025 | 16.6.2025 | Dips and sauces made easy. Legendary cabin cake. Holiday cook's tomato dishes. Cool summer wines. |
| 7 | 21.8.2025 | 31.7.2025 | 4.8.2025 | Quick weekday meals from around the world. Modern home classics. New flavors for the mushroom season. |
| 8 | 25.9.2025 | 4.9.2025 | 8.9.2025 | Italy! Pizza from Rome to Palermo. Challengers of pesto. Quarter-hour pastas. Frugal kitchen inventions. Pasta wines. |
| 9 | 23.10.2025 | 2.10.2025 | 6.10.2025 | Best restaurants, wines, market finds, and other joys of 2025. Fall baking. |
| 10 | 27.11.2025 | 6.11.2025 | 10.11.2025 | Christmas around the world. Starters, main dishes, cheeses, desserts, baking. Drink extra. |
Ei aikatauluja vuodelle 2026.
Prices
| Ad | Placement | Size | Bleed | Price (tax 0%) |
|---|---|---|---|---|
| 2/1 landscape | Not specified | 460 x 297 mm | 5 mm | 14 507 € |
| 2/1 landscape | First spread | 460 x 297 mm | 5 mm | 16 681 € |
| 2/1 landscape | 2. Spread | 460 x 297 mm | 5 mm | 15 971 € |
| 1/1 portrait | Not specified | 230 x 297 mm | 5 mm | 7 253 € |
| 1/1 portrait | 2. Cover | 230 x 297 mm | 5 mm | 8 021 € |
| 1/1 portrait | 3. Cover | 230 x 297 mm | 5 mm | 8 021 € |
| 1/1 portrait | Back cover | 230 x 272 mm | 5 mm | 8 368 € |
| 1/2 portrait | Not specified | 112 x 297 mm | 5 mm | 5 217 € |
| 1/2 landscape | Not specified | 230 x 146 mm | 5 mm | 5 217 € |
| 1/3 portrait | Not specified | 76 x 297 mm | 5 mm | 4 497 € |
| 1/3 landscape | Not specified | 230 x 99 mm | 5 mm | 4 497 € |
| 1/4 portrait | Not specified | 60 x 297 mm | 5 mm | 3 821 € |
| 1/4 landscape | Not specified | 230 x 74 mm | 5 mm | 3 821 € |
| 1/4 square | Not specified | 112 x 146 mm | 5 mm | 3 821 € | *) size without marginal Prices valid until 31.12.2025 |
Size
230 x 297 mm
Printing method
Offset
Binding
Liimasidonta
Printer
Printall AS
Delivery of ad material and instructions
Aineisto toimitetaan varauksen vahvistamisen jälkeen lähetettävän aineistolinkin kautta. Ilmoitusvaraukseen nimetty aineistontoimittaja saa aineistolinkin sähköpostiinsa. Aineiston jättöaika on aineistopäivänä klo 12 mennessä.
ICC profile
Technical information
Valmis aineisto on PDF-tiedosto, joka sisältää kaikki ilmoitukseen kuuluvat elementit: tekstit, kuvat, grafiikat, ja fontit. Valmista aineistoa ei muokata lehdessä, vaan se julkaistaan sellaisenaan. Aineiston koko tulee olla sama kuin ilmoituksen koko, kokosivuissa lopullinen puhtaaksileikattu koko. Leikkuuvarat 5 mm ilmoituksen jokaisella reunalla. Leikkuumerkit on sisällytettävä lopullisiin sivutiedostoihin. Vältät tekstien leikkaantumisen, kun et sijoita tekstejä etkä muita oleellisia asioita (esim. logoja) 5 mm lähemmäksi puhtaaksileikkausta. Tarkemmat tekniset tiedot: media.sanoma.fi/suunnittelijan-tyokalut/aineisto-ja-varaustiedot/printtimainonnan-aineisto-ohjeet.
Terms of delivery
Check the delivery conditions from the publisher
| Ad | Placement | Size | Bleed | Price (tax 0%) | *) size without marginal Prices valid until 31.12.2026 |
|---|
Size
230 x 297 mm
Printing method
Offset
Binding
Liimasidonta
Printer
Printall AS
Delivery of ad material and instructions
Aineisto toimitetaan varauksen vahvistamisen jälkeen lähetettävän aineistolinkin kautta. Ilmoitusvaraukseen nimetty aineistontoimittaja saa aineistolinkin sähköpostiinsa. Aineiston jättöaika on aineistopäivänä klo 12 mennessä.
ICC profile
Technical information
Valmis aineisto on PDF-tiedosto, joka sisältää kaikki ilmoitukseen kuuluvat elementit: tekstit, kuvat, grafiikat, ja fontit. Valmista aineistoa ei muokata lehdessä, vaan se julkaistaan sellaisenaan. Aineiston koko tulee olla sama kuin ilmoituksen koko, kokosivuissa lopullinen puhtaaksileikattu koko. Leikkuuvarat 5 mm ilmoituksen jokaisella reunalla. Leikkuumerkit on sisällytettävä lopullisiin sivutiedostoihin. Vältät tekstien leikkaantumisen, kun et sijoita tekstejä etkä muita oleellisia asioita (esim. logoja) 5 mm lähemmäksi puhtaaksileikkausta. Tarkemmat tekniset tiedot: media.sanoma.fi/suunnittelijan-tyokalut/aineisto-ja-varaustiedot/printtimainonnan-aineisto-ohjeet.
Terms of delivery
Check the delivery conditions from the publisher
| Ad | Description | Size | Price (tax 0%) |
Prices valid until 31.12.2025 |
|---|
| Ad | Description | Size | Price (tax 0%) |
Prices valid until 31.12.2026 |
|---|
Readers
Gender
Audience in digital and print
Age
Municipality type
Education
Gross household income, daily purchases
NRS Facts
| Reader profile | All 15+ % | Magazine Readers % | Amount of readers | |
|---|---|---|---|---|
| Sex | Women | 51 | 67 | 105 300 |
| Men | 49 | 33 | 51 900 | |
| Native language | Finnish | 95 | 96 | 150 900 |
| Swedish | 5 | 4 | 6 300 | |
| Age | 15-24 y | 13 | 3 | 4 700 |
| 25-34 y | 14 | 11 | 17 300 | |
| 35-44 y | 14 | 16 | 25 200 | |
| 45-54 y | 14 | 16 | 25 200 | |
| 55-64 y | 16 | 20 | 31 400 | |
| 65+ y | 30 | 34 | 53 400 | |
| Gender + age | Female 15-29 years | 10 | 4 | 6 300 |
| Female 30-49 years | 14 | 20 | 31 400 | |
| Female 50+ years | 28 | 43 | 67 600 | |
| Male 15-29 years | 10 | 3 | 4 700 | |
| Male 30-49 years | 15 | 10 | 15 700 | |
| Male 50+ years | 24 | 20 | 31 400 | |
| Household position | Lives at home with parents | 7 | 1 | 1 600 |
| Lives alone | 29 | 25 | 39 300 | |
| Lives with spouse | 36 | 43 | 67 600 | |
| Lives with spouse and children | 24 | 26 | 40 900 | |
| Single parent | 3 | 3 | 4 700 | |
| Other | 3 | 2 | 3 100 | |
| Grandchildren under 18 years of age | Yes | 20 | 26 | 40 900 |
| No | 39 | 44 | 69 200 | |
| No answer (under 45 year olds) | 41 | 30 | 47 200 | |
| Education | Elementary school | 5 | 2 | 3 100 |
| Secondary school | 6 | 3 | 4 700 | |
| Vocational | 28 | 20 | 31 400 | |
| High school | 14 | 11 | 17 300 | |
| University of Applied Sciences | 20 | 20 | 31 400 | |
| University | 26 | 41 | 64 500 | |
| Something else | 2 | 3 | 4 700 | |
| Decision-maker in grocery purchases | Yes | 93 | 95 | 149 300 |
| No | 7 | 5 | 7 900 | |
| Can not say | 1 | 1 | 1 600 | |
| Use of glasses or contact lenses | Yes | 68 | 77 | 121 000 |
| No | 32 | 23 | 36 200 | |
| Size of the household | 1 pers | 29 | 24 | 37 700 |
| 2 pers | 38 | 47 | 73 900 | |
| 3 pers | 14 | 13 | 20 400 | |
| 4 pers | 12 | 11 | 17 300 | |
| 5+ pers | 7 | 4 | 6 300 | |
| Household income (gross) | Below 20 000 € /y | 11 | 6 | 9 400 |
| 20 000 - 35 000 € /y | 18 | 12 | 18 900 | |
| 35 001 - 50 000 € /y | 19 | 18 | 28 300 | |
| 50 001 - 85 000 € /y | 21 | 22 | 34 600 | |
| 85 001 - 100 000 € /y | 8 | 12 | 18 900 | |
| Over 100 000 € /y | 10 | 22 | 34 600 | |
| Dont want to tell | 5 | 5 | 7 900 | |
| Cant say / No answer | 8 | 3 | 4 700 | |
| Family with kids | Yes | 32 | 28 | 44 000 |
| No | 68 | 72 | 113 200 | |
| 13 | 13 | 20 400 | ||
| 13 | 11 | 17 300 | ||
| 5 | 3 | 4 700 | ||
| 1 | 1 | 1 600 | ||
| 1 | 0 | 0 | ||
| 68 | 72 | 113 200 | ||
| 0 | 0 | 0 | ||
| Pets in household | Cat | 17 | 13 | 20 400 |
| Dog | 26 | 22 | 34 600 | |
| Some other pet | 5 | 4 | 6 300 | |
| No pets | 60 | 67 | 105 300 | |
| Health services used in the household | Public health services | 85 | 82 | 128 900 |
| Employer - funded health care services | 50 | 55 | 86 500 | |
| Private, self-funded healthcare services | 38 | 47 | 73 900 | |
| Private health insurance services | 24 | 25 | 39 300 | |
| No health care | 1 | 0 | 0 | |
| Can not say | 1 | 0 | 0 | |
| Housing | Apartment | 32 | 36 | 56 600 |
| Row house or semi-detached house | 15 | 19 | 29 900 | |
| Detached house | 47 | 42 | 66 000 | |
| Farm | 5 | 3 | 4 700 | |
| Something else | 1 | 1 | 1 600 | |
| Can not say | 0 | 0 | 0 | |
| Ownership of housing | Owner-occupied residence | 77 | 82 | 128 900 |
| Rented residence | 19 | 14 | 22 000 | |
| Right of residence apartment | 2 | 2 | 3 100 | |
| Something else | 1 | 1 | 1 600 | |
| Can not say | 1 | 0 | 0 | |
| Cottage or holiday home in regular use | Yes | 41 | 48 | 75 500 |
| No | 58 | 52 | 81 700 | |
| Can not say | 1 | 0 | 0 | |
| Number of cars in household | One car | 46 | 50 | 78 600 |
| Two cars | 31 | 31 | 48 700 | |
| Three or more cars | 10 | 6 | 9 400 | |
| No car | 14 | 13 | 20 400 | |
| Type of car, if buying now | New | 21 | 26 | 40 900 |
| Used | 68 | 61 | 95 900 | |
| Company car | 4 | 5 | 7 900 | |
| Leasing (personal) | 8 | 12 | 18 900 | |
| Shared car | 3 | 4 | 6 300 | |
| Doesn't use a car | 9 | 8 | 12 600 | |
| Can not say | 5 | 6 | 9 400 | |
| Advertising ban at the door / mailbox | Yes | 26 | 31 | 48 700 |
| No | 74 | 69 | 108 500 | |
| Can not say | 0 | 0 | 0 | |
| Using AdBlocker or similar application | Yes | 19 | 15 | 23 600 |
| No | 76 | 80 | 125 800 | |
| Can not say | 5 | 6 | 9 400 | |
| Type of municipality (7 class) | Greater Helsinki | 19 | 35 | 55 000 |
| Turku or Tampere | 8 | 9 | 14 100 | |
| Oulu | 4 | 3 | 4 700 | |
| 70 000 - 150 000 inhabitants town | 13 | 12 | 18 900 | |
| Urban municipality | 27 | 24 | 37 700 | |
| Conurbation | 15 | 10 | 15 700 | |
| Countryside | 13 | 8 | 12 600 | Source: NRS 2024 |
| How often different content is read | All 15+ % | Magazine Readers % | Amount of readers | |
|---|---|---|---|---|
| The frequency of reading: Print magazines | Daily | 14 | 19 | 29 900 |
| 5-6 days a week | 4 | 4 | 6 300 | |
| 1-4 days a week | 25 | 39 | 61 300 | |
| Monthly | 24 | 27 | 42 400 | |
| Rarely | 24 | 10 | 15 700 | |
| Never | 8 | 1 | 1 600 | |
| Can not say | 1 | 0 | 0 | |
| The frequency of reading: Magazine content in digital format | Daily | 22 | 23 | 36 200 |
| 5-6 days a week | 6 | 6 | 9 400 | |
| 1-4 days a week | 19 | 21 | 33 000 | |
| Monthly | 15 | 19 | 29 900 | |
| Rarely | 23 | 22 | 34 600 | |
| Never | 14 | 9 | 14 100 | |
| Can not say | 1 | 1 | 1 600 | |
| The frequency of reading: Print newspapers or afternoon papers | Daily | 28 | 40 | 62 900 |
| 5-6 days a week | 4 | 4 | 6 300 | |
| 1-4 days a week | 23 | 22 | 34 600 | |
| Monthly | 14 | 12 | 18 900 | |
| Rarely | 23 | 18 | 28 300 | |
| Never | 8 | 3 | 4 700 | |
| Can not say | 1 | 0 | 0 | |
| The frequency of reading: Newspaper or afternoon paper content in digital format | Daily | 54 | 63 | 99 000 |
| 5-6 days a week | 10 | 9 | 14 100 | |
| 1-4 days a week | 16 | 14 | 22 000 | |
| Monthly | 6 | 4 | 6 300 | |
| Rarely | 9 | 7 | 11 000 | |
| Never | 6 | 3 | 4 700 | |
| Can not say | 1 | 0 | 0 | |
| The frequency of reading: Free and free delivery newspapers | Daily | 5 | 5 | 7 900 |
| 5-6 days a week | 4 | 4 | 6 300 | |
| 1-4 days a week | 42 | 44 | 69 200 | |
| Monthly | 18 | 19 | 29 900 | |
| Rarely | 22 | 22 | 34 600 | |
| Never | 9 | 7 | 11 000 | |
| Can not say | 1 | 0 | 0 | |
| The frequency of watching: Free online TV services | Daily | 16 | 19 | 29 900 |
| 5-6 days a week | 10 | 12 | 18 900 | |
| 1-4 days a week | 30 | 30 | 47 200 | |
| Monthly | 23 | 22 | 34 600 | |
| Rarely | 14 | 12 | 18 900 | |
| Never | 6 | 5 | 7 900 | |
| Can not say | 1 | 1 | 1 600 | |
| The frequency of watching: Pay TV and streaming services | Daily | 15 | 12 | 18 900 |
| 5-6 days a week | 10 | 10 | 15 700 | |
| 1-4 days a week | 22 | 24 | 37 700 | |
| Monthly | 10 | 11 | 17 300 | |
| Rarely | 12 | 11 | 17 300 | |
| Never | 30 | 30 | 47 200 | |
| Can not say | 1 | 0 | 0 | |
| The frequency of watching: Programs of YLE (national broadcaster) TV channels | Daily | 44 | 51 | 80 200 |
| 5-6 days a week | 10 | 12 | 18 900 | |
| 1-4 days a week | 20 | 19 | 29 900 | |
| Monthly | 12 | 9 | 14 100 | |
| Rarely | 11 | 7 | 11 000 | |
| Never | 3 | 1 | 1 600 | |
| Can not say | 0 | 0 | 0 | |
| The frequency of watching: Programs of commercial TV channels | Daily | 34 | 37 | 58 200 |
| 5-6 days a week | 12 | 12 | 18 900 | |
| 1-4 days a week | 23 | 26 | 40 900 | |
| Monthly | 12 | 11 | 17 300 | |
| Rarely | 13 | 10 | 15 700 | |
| Never | 6 | 4 | 6 300 | |
| Can not say | 0 | 0 | 0 | |
| The frequency of listening: Programs of YLE (national broadcaster) radio-channels | Daily | 21 | 25 | 39 300 |
| 5-6 days a week | 7 | 7 | 11 000 | |
| 1-4 days a week | 16 | 18 | 28 300 | |
| Monthly | 13 | 16 | 25 200 | |
| Rarely | 26 | 23 | 36 200 | |
| Never | 16 | 11 | 17 300 | |
| Can not say | 1 | 0 | 0 | |
| The frequency of listening: Programs of commercial radio channels | Daily | 16 | 16 | 25 200 |
| 5-6 days a week | 9 | 9 | 14 100 | |
| 1-4 days a week | 22 | 24 | 37 700 | |
| Monthly | 14 | 16 | 25 200 | |
| Rarely | 22 | 22 | 34 600 | |
| Never | 16 | 13 | 20 400 | |
| Can not say | 1 | 0 | 0 | |
| The frequency of listening: Podcasts | Daily | 5 | 3 | 4 700 |
| 5-6 days a week | 3 | 3 | 4 700 | |
| 1-4 days a week | 10 | 11 | 17 300 | |
| Monthly | 14 | 15 | 23 600 | |
| Rarely | 29 | 29 | 45 600 | |
| Never | 38 | 37 | 58 200 | |
| Can not say | 2 | 1 | 1 600 | |
| User frequency and following: Social media | Daily | 59 | 58 | 91 200 |
| 5-6 days a week | 7 | 9 | 14 100 | |
| 1-4 days a week | 7 | 7 | 11 000 | |
| Monthly | 3 | 3 | 4 700 | |
| Rarely | 6 | 6 | 9 400 | |
| Never | 17 | 17 | 26 700 | |
| Can not say | 0 | 0 | 0 | |
| User frequency and following: Bloggers, YouTubers, or social media influencers | Daily | 13 | 10 | 15 700 |
| 5-6 days a week | 6 | 4 | 6 300 | |
| 1-4 days a week | 12 | 10 | 15 700 | |
| Monthly | 8 | 10 | 15 700 | |
| Rarely | 21 | 26 | 40 900 | |
| Never | 40 | 40 | 62 900 | |
| Can not say | 1 | 1 | 1 600 | |
| User frequency: Instant messaging | Daily | 69 | 75 | 117 900 |
| 5-6 days a week | 10 | 7 | 11 000 | |
| 1-4 days a week | 9 | 8 | 12 600 | |
| Monthly | 3 | 3 | 4 700 | |
| Rarely | 3 | 2 | 3 100 | |
| Never | 6 | 6 | 9 400 | |
| Can not say | 0 | 0 | 0 | |
| Daily | 16 | 20 | 31 400 | |
| 5-6 days a week | 6 | 9 | 14 100 | |
| 1-4 days a week | 14 | 16 | 25 200 | |
| Monthly | 22 | 25 | 39 300 | |
| Rarely | 35 | 27 | 42 400 | |
| Never | 7 | 4 | 6 300 | |
| Can not say | 0 | 0 | 0 | |
| Daily | 3 | 3 | 4 700 | |
| 5-6 days a week | 2 | 2 | 3 100 | |
| 1-4 days a week | 4 | 5 | 7 900 | |
| Monthly | 7 | 8 | 12 600 | |
| Rarely | 30 | 34 | 53 400 | |
| Never | 53 | 47 | 73 900 | |
| Can not say | 1 | 1 | 1 600 | |
| Daily | 6 | 7 | 11 000 | |
| 5-6 days a week | 3 | 3 | 4 700 | |
| 1-4 days a week | 5 | 8 | 12 600 | |
| Monthly | 8 | 9 | 14 100 | |
| Rarely | 23 | 22 | 34 600 | |
| Never | 55 | 51 | 80 200 | |
| Can not say | 1 | 1 | 1 600 | |
| Daily | 19 | 12 | 18 900 | |
| 5-6 days a week | 9 | 6 | 9 400 | |
| 1-4 days a week | 23 | 22 | 34 600 | |
| Monthly | 22 | 29 | 45 600 | |
| Rarely | 18 | 19 | 29 900 | |
| Never | 10 | 12 | 18 900 | |
| Can not say | 0 | 0 | 0 | |
| Daily | 4 | 8 | 12 600 | |
| 5-6 days a week | 2 | 3 | 4 700 | |
| 1-4 days a week | 7 | 10 | 15 700 | |
| Monthly | 7 | 9 | 14 100 | |
| Rarely | 12 | 14 | 22 000 | |
| Never | 61 | 51 | 80 200 | |
| Cant say / No answer | 7 | 7 | 11 000 | |
| Daily | 41 | 44 | 69 200 | |
| 5-6 days a week | 8 | 11 | 17 300 | |
| 1-4 days a week | 10 | 10 | 15 700 | |
| Monthly | 6 | 5 | 7 900 | |
| Rarely | 8 | 7 | 11 000 | |
| Never | 22 | 18 | 28 300 | |
| Cant say / No answer | 4 | 5 | 7 900 | |
| Daily | 31 | 29 | 45 600 | |
| 5-6 days a week | 6 | 7 | 11 000 | |
| 1-4 days a week | 9 | 11 | 17 300 | |
| Monthly | 5 | 4 | 6 300 | |
| Rarely | 10 | 12 | 18 900 | |
| Never | 34 | 33 | 51 900 | |
| Cant say / No answer | 5 | 5 | 7 900 | |
| Daily | 14 | 6 | 9 400 | |
| 5-6 days a week | 2 | 1 | 1 600 | |
| 1-4 days a week | 3 | 2 | 3 100 | |
| Monthly | 2 | 2 | 3 100 | |
| Rarely | 5 | 6 | 9 400 | |
| Never | 69 | 79 | 124 200 | |
| Cant say / No answer | 5 | 5 | 7 900 | |
| Daily | 6 | 7 | 11 000 | |
| 5-6 days a week | 2 | 2 | 3 100 | |
| 1-4 days a week | 5 | 8 | 12 600 | |
| Monthly | 5 | 5 | 7 900 | |
| Rarely | 12 | 13 | 20 400 | |
| Never | 65 | 61 | 95 900 | |
| Cant say / No answer | 5 | 5 | 7 900 | |
| Daily | 10 | 5 | 7 900 | |
| 5-6 days a week | 3 | 2 | 3 100 | |
| 1-4 days a week | 4 | 4 | 6 300 | |
| Monthly | 3 | 4 | 6 300 | |
| Rarely | 9 | 10 | 15 700 | |
| Never | 68 | 72 | 113 200 | |
| Cant say / No answer | 5 | 5 | 7 900 | Source: NRS 2024 |
| Consumer claims | All 15+ % | Magazine Readers % | Amount of readers | |
|---|---|---|---|---|
| I enjoy shopping | Completely agree | 13 | 13 | 20 400 |
| Partially agree | 44 | 45 | 70 700 | |
| Partially disagree | 31 | 32 | 50 300 | |
| Completely disagree | 10 | 9 | 14 100 | |
| Can not say | 2 | 2 | 3 100 | |
| I prefer domestic products | Completely agree | 32 | 33 | 51 900 |
| Partially agree | 55 | 56 | 88 000 | |
| Partially disagree | 10 | 8 | 12 600 | |
| Completely disagree | 1 | 1 | 1 600 | |
| Can not say | 1 | 1 | 1 600 | |
| I consciously make responsible choices in my consumption | Completely agree | 19 | 21 | 33 000 |
| Partially agree | 55 | 58 | 91 200 | |
| Partially disagree | 19 | 15 | 23 600 | |
| Completely disagree | 4 | 3 | 4 700 | |
| Can not say | 3 | 2 | 3 100 | |
| When shopping, quality is more important to me than price | Completely agree | 22 | 25 | 39 300 |
| Partially agree | 57 | 59 | 92 700 | |
| Partially disagree | 17 | 13 | 20 400 | |
| Completely disagree | 2 | 1 | 1 600 | |
| Can not say | 2 | 1 | 1 600 | |
| I usually choose the cheapest option | Completely agree | 12 | 9 | 14 100 |
| Partially agree | 47 | 43 | 67 600 | |
| Partially disagree | 34 | 41 | 64 500 | |
| Completely disagree | 6 | 6 | 9 400 | |
| Can not say | 1 | 1 | 1 600 | |
| I often take advantage of discount and campaign prices in my purchases | Completely agree | 37 | 36 | 56 600 |
| Partially agree | 51 | 52 | 81 700 | |
| Partially disagree | 9 | 9 | 14 100 | |
| Completely disagree | 2 | 2 | 3 100 | |
| Can not say | 1 | 1 | 1 600 | |
| In my circle of friends, I am often the first to try new things | Completely agree | 6 | 5 | 7 900 |
| Partially agree | 25 | 26 | 40 900 | |
| Partially disagree | 38 | 40 | 62 900 | |
| Completely disagree | 24 | 23 | 36 200 | |
| Can not say | 7 | 7 | 11 000 | |
| In my opinion, money is for consumption and not for saving | Completely agree | 5 | 3 | 4 700 |
| Partially agree | 35 | 35 | 55 000 | |
| Partially disagree | 46 | 50 | 78 600 | |
| Completely disagree | 11 | 10 | 15 700 | |
| Can not say | 3 | 2 | 3 100 | |
| I prefer local shops and services | Completely agree | 27 | 28 | 44 000 |
| Partially agree | 57 | 60 | 94 300 | |
| Partially disagree | 12 | 11 | 17 300 | |
| Completely disagree | 2 | 1 | 1 600 | |
| Can not say | 2 | 1 | 1 600 | |
| I want to see advertising targeted to me based on my online behavior | Completely agree | 4 | 3 | 4 700 |
| Partially agree | 28 | 31 | 48 700 | |
| Partially disagree | 31 | 30 | 47 200 | |
| Completely disagree | 32 | 32 | 50 300 | |
| Can not say | 5 | 5 | 7 900 | |
| When I want a certain brand of product, the price doesn't matter | Completely agree | 9 | 10 | 15 700 |
| Partially agree | 32 | 36 | 56 600 | |
| Partially disagree | 37 | 36 | 56 600 | |
| Completely disagree | 22 | 17 | 26 700 | |
| Can not say | 2 | 1 | 1 600 | |
| I prefer certified products in my purchases (e.g. Fairtrade, The Nordic Swan Ecolabel, Avainlippu) | Completely agree | 17 | 17 | 26 700 |
| Partially agree | 50 | 55 | 86 500 | |
| Partially disagree | 24 | 22 | 34 600 | |
| Completely disagree | 6 | 5 | 7 900 | |
| Can not say | 3 | 2 | 3 100 | |
| Ecology is an important purchase reason for me | Completely agree | 16 | 18 | 28 300 |
| Partially agree | 51 | 57 | 89 600 | |
| Partially disagree | 24 | 19 | 29 900 | |
| Completely disagree | 7 | 4 | 6 300 | |
| Can not say | 3 | 2 | 3 100 | |
| I prefer well-known brands | Completely agree | 12 | 13 | 20 400 |
| Partially agree | 57 | 60 | 94 300 | |
| Partially disagree | 23 | 21 | 33 000 | |
| Completely disagree | 5 | 4 | 6 300 | |
| Can not say | 3 | 2 | 3 100 | Source: NRS 2024 |
| Attitude towards advertising in different media channels | All 15+ % | Magazine Readers % | Amount of readers | |
|---|---|---|---|---|
| Newspapers | Very positive | 13 | 15 | 23 600 |
| Quite positively | 63 | 65 | 102 200 | |
| Quite negatively | 15 | 14 | 22 000 | |
| Very negative | 4 | 3 | 4 700 | |
| Can not say | 5 | 4 | 6 300 | |
| Magazines | Very positive | 14 | 17 | 26 700 |
| Quite positively | 61 | 62 | 97 500 | |
| Quite negatively | 16 | 14 | 22 000 | |
| Very negative | 4 | 2 | 3 100 | |
| Can not say | 6 | 5 | 7 900 | |
| Free and local newspapers | Very positive | 24 | 28 | 44 000 |
| Quite positively | 57 | 58 | 91 200 | |
| Quite negatively | 10 | 8 | 12 600 | |
| Very negative | 3 | 2 | 3 100 | |
| Can not say | 5 | 4 | 6 300 | |
| Newspaper/Magazine websites or applications | Very positive | 7 | 8 | 12 600 |
| Quite positively | 47 | 47 | 73 900 | |
| Quite negatively | 28 | 30 | 47 200 | |
| Very negative | 9 | 7 | 11 000 | |
| Can not say | 8 | 8 | 12 600 | |
| Social media (Facebook, Instagram etc.) | Very positive | 6 | 5 | 7 900 |
| Quite positively | 34 | 33 | 51 900 | |
| Quite negatively | 32 | 33 | 51 900 | |
| Very negative | 16 | 15 | 23 600 | |
| Can not say | 13 | 13 | 20 400 | |
| Blogs | Very positive | 4 | 3 | 4 700 |
| Quite positively | 27 | 28 | 44 000 | |
| Quite negatively | 28 | 28 | 44 000 | |
| Very negative | 15 | 14 | 22 000 | |
| Can not say | 27 | 27 | 42 400 | |
| Newsletters to email | Very positive | 2 | 2 | 3 100 |
| Quite positively | 18 | 17 | 26 700 | |
| Quite negatively | 34 | 38 | 59 700 | |
| Very negative | 43 | 42 | 66 000 | |
| Can not say | 3 | 2 | 3 100 | |
| Other websites | Very positive | 4 | 4 | 6 300 |
| Quite positively | 39 | 37 | 58 200 | |
| Quite negatively | 33 | 36 | 56 600 | |
| Very negative | 13 | 11 | 17 300 | |
| Can not say | 11 | 12 | 18 900 | |
| Commercial TV channels (MTV3, Nelonen, Sub, FOX etc.) | Very positive | 9 | 8 | 12 600 |
| Quite positively | 48 | 49 | 77 000 | |
| Quite negatively | 28 | 29 | 45 600 | |
| Very negative | 13 | 11 | 17 300 | |
| Can not say | 4 | 3 | 4 700 | |
| Commercial radio channels (Radio Nova, SuomiPOP, NRJ, Iskelmä etc.) | Very positive | 5 | 5 | 7 900 |
| Quite positively | 36 | 35 | 55 000 | |
| Quite negatively | 33 | 37 | 58 200 | |
| Very negative | 19 | 18 | 28 300 | |
| Can not say | 6 | 5 | 7 900 | |
| Home delivered advertisements and catalogues | Very positive | 20 | 21 | 33 000 |
| Quite positively | 47 | 47 | 73 900 | |
| Quite negatively | 16 | 15 | 23 600 | |
| Very negative | 13 | 14 | 22 000 | |
| Can not say | 4 | 3 | 4 700 | |
| Out-of-home advertising | Very positive | 12 | 13 | 20 400 |
| Quite positively | 53 | 56 | 88 000 | |
| Quite negatively | 20 | 18 | 28 300 | |
| Very negative | 7 | 6 | 9 400 | |
| Can not say | 7 | 7 | 11 000 | Source: NRS 2024 |
| Reading device and advertising effect | All 15+ % | Magazine Readers % | Amount of readers | |
|---|---|---|---|---|
| I relax and get inspired by magazines | Completely agree | 17 | 25 | 39 300 |
| Partially agree | 61 | 61 | 95 900 | |
| Partially disagree | 11 | 8 | 12 600 | |
| Completely disagree | 4 | 2 | 3 100 | |
| Can not say | 7 | 4 | 6 300 | |
| Completely agree | 17 | 18 | 28 300 | |
| Partially agree | 58 | 61 | 95 900 | |
| Partially disagree | 14 | 12 | 18 900 | |
| Completely disagree | 5 | 3 | 4 700 | |
| Can not say | 7 | 5 | 7 900 | |
| A professional magazine keeps me up to date on professional matters | Completely agree | 22 | 26 | 40 900 |
| Partially agree | 48 | 50 | 78 600 | |
| Partially disagree | 12 | 10 | 15 700 | |
| Completely disagree | 5 | 3 | 4 700 | |
| Can not say | 13 | 11 | 17 300 | |
| The industry specialty magazine provides information on my hobbies and interests | Completely agree | 31 | 36 | 56 600 |
| Partially agree | 50 | 52 | 81 700 | |
| Partially disagree | 7 | 5 | 7 900 | |
| Completely disagree | 3 | 1 | 1 600 | |
| Can not say | 9 | 6 | 9 400 | |
| Finnish magazines offer reliable comparisons and tests | Completely agree | 16 | 19 | 29 900 |
| Partially agree | 52 | 52 | 81 700 | |
| Partially disagree | 14 | 14 | 22 000 | |
| Completely disagree | 3 | 2 | 3 100 | |
| Can not say | 15 | 13 | 20 400 | |
| Finnish magazines offer reliable product recommendations | Completely agree | 10 | 11 | 17 300 |
| Partially agree | 54 | 54 | 84 900 | |
| Partially disagree | 18 | 19 | 29 900 | |
| Completely disagree | 3 | 2 | 3 100 | |
| Can not say | 15 | 14 | 22 000 | |
| Finnish magazines are of high quality | Completely agree | 22 | 25 | 39 300 |
| Partially agree | 59 | 61 | 95 900 | |
| Partially disagree | 9 | 9 | 14 100 | |
| Completely disagree | 2 | 1 | 1 600 | |
| Can not say | 8 | 4 | 6 300 | |
| I follow important magazines on social media | Completely agree | 7 | 6 | 9 400 |
| Partially agree | 25 | 23 | 36 200 | |
| Partially disagree | 25 | 29 | 45 600 | |
| Completely disagree | 34 | 35 | 55 000 | |
| Can not say | 9 | 8 | 12 600 | |
| I read important magazines from cover to cover | Completely agree | 18 | 23 | 36 200 |
| Partially agree | 34 | 36 | 56 600 | |
| Partially disagree | 28 | 26 | 40 900 | |
| Completely disagree | 16 | 12 | 18 900 | |
| Can not say | 5 | 3 | 4 700 | |
| Ads in magazines make new things familiar | Completely agree | 10 | 12 | 18 900 |
| Partially agree | 50 | 51 | 80 200 | |
| Partially disagree | 24 | 26 | 40 900 | |
| Completely disagree | 8 | 6 | 9 400 | |
| Can not say | 8 | 5 | 7 900 | |
| Completely agree | 10 | 10 | 15 700 | |
| Partially agree | 36 | 37 | 58 200 | |
| Partially disagree | 24 | 23 | 36 200 | |
| Completely disagree | 23 | 23 | 36 200 | |
| Can not say | 8 | 8 | 12 600 | |
| I have purchased products based on the ad in magazine | Completely agree | 9 | 9 | 14 100 |
| Partially agree | 36 | 41 | 64 500 | |
| Partially disagree | 26 | 27 | 42 400 | |
| Completely disagree | 22 | 18 | 28 300 | |
| Can not say | 6 | 5 | 7 900 | |
| I'm trying out tips or guidelines (like recipes) in magazine ads | Completely agree | 13 | 18 | 28 300 |
| Partially agree | 49 | 51 | 80 200 | |
| Partially disagree | 20 | 19 | 29 900 | |
| Completely disagree | 13 | 9 | 14 100 | |
| Can not say | 5 | 3 | 4 700 | |
| I'm experimenting with product samples in magazines (like food or cosmetics) | Completely agree | 9 | 12 | 18 900 |
| Partially agree | 29 | 33 | 51 900 | |
| Partially disagree | 29 | 28 | 44 000 | |
| Completely disagree | 27 | 23 | 36 200 | |
| Can not say | 6 | 5 | 7 900 | |
| Completely agree | 2 | 1 | 1 600 | |
| Partially agree | 19 | 14 | 22 000 | |
| Partially disagree | 33 | 35 | 55 000 | |
| Completely disagree | 38 | 40 | 62 900 | |
| Can not say | 9 | 10 | 15 700 | |
| Completely agree | 16 | 16 | 25 200 | |
| Partially agree | 40 | 39 | 61 300 | |
| Partially disagree | 23 | 26 | 40 900 | |
| Completely disagree | 12 | 11 | 17 300 | |
| Can not say | 8 | 8 | 12 600 | Source: NRS 2024 |
| Use of information sources during the purchase process | All 15+ % | Magazine Readers % | Amount of readers | |
|---|---|---|---|---|
| Information sources, cars and car purchase | Print magazines | 11 | 13 | 20 400 |
| Newspapers | 13 | 16 | 25 200 | |
| Magazine websites | 7 | 7 | 11 000 | |
| Newspaper websites | 8 | 9 | 14 100 | |
| Blogs | 3 | 2 | 3 100 | |
| Social media | 14 | 10 | 15 700 | |
| Other websites | 42 | 41 | 64 500 | |
| Television | 10 | 10 | 15 700 | |
| Radio | 2 | 1 | 1 600 | |
| Direct mail | 10 | 10 | 15 700 | |
| None of these | 40 | 41 | 64 500 | |
| Information sources, consumer electronics and information technology | Print magazines | 15 | 18 | 28 300 |
| Newspapers | 18 | 20 | 31 400 | |
| Magazine websites | 10 | 11 | 17 300 | |
| Newspaper websites | 11 | 14 | 22 000 | |
| Blogs | 6 | 5 | 7 900 | |
| Social media | 26 | 22 | 34 600 | |
| Other websites | 49 | 50 | 78 600 | |
| Television | 17 | 18 | 28 300 | |
| Radio | 3 | 3 | 4 700 | |
| Direct mail | 36 | 37 | 58 200 | |
| None of these | 17 | 16 | 25 200 | |
| Information sources, beauty care and cosmetics | Print magazines | 18 | 28 | 44 000 |
| Newspapers | 8 | 10 | 15 700 | |
| Magazine websites | 10 | 12 | 18 900 | |
| Newspaper websites | 6 | 8 | 12 600 | |
| Blogs | 8 | 10 | 15 700 | |
| Social media | 28 | 28 | 44 000 | |
| Other websites | 16 | 18 | 28 300 | |
| Television | 14 | 16 | 25 200 | |
| Radio | 2 | 2 | 3 100 | |
| Direct mail | 17 | 18 | 28 300 | |
| None of these | 45 | 37 | 58 200 | |
| Information sources, travel | Print magazines | 16 | 25 | 39 300 |
| Newspapers | 15 | 21 | 33 000 | |
| Magazine websites | 10 | 13 | 20 400 | |
| Newspaper websites | 10 | 12 | 18 900 | |
| Blogs | 11 | 12 | 18 900 | |
| Social media | 34 | 34 | 53 400 | |
| Other websites | 47 | 53 | 83 300 | |
| Television | 16 | 18 | 28 300 | |
| Radio | 3 | 3 | 4 700 | |
| Direct mail | 9 | 12 | 18 900 | |
| None of these | 27 | 20 | 31 400 | |
| Information sources, style and fashion | Print magazines | 23 | 36 | 56 600 |
| Newspapers | 13 | 18 | 28 300 | |
| Magazine websites | 13 | 19 | 29 900 | |
| Newspaper websites | 8 | 10 | 15 700 | |
| Blogs | 9 | 10 | 15 700 | |
| Social media | 34 | 35 | 55 000 | |
| Other websites | 33 | 38 | 59 700 | |
| Television | 18 | 20 | 31 400 | |
| Radio | 2 | 2 | 3 100 | |
| Direct mail | 25 | 25 | 39 300 | |
| None of these | 29 | 24 | 37 700 | |
| Information sources, building and renovating | Print magazines | 19 | 24 | 37 700 |
| Newspapers | 15 | 17 | 26 700 | |
| Magazine websites | 9 | 11 | 17 300 | |
| Newspaper websites | 8 | 10 | 15 700 | |
| Blogs | 6 | 7 | 11 000 | |
| Social media | 23 | 23 | 36 200 | |
| Other websites | 32 | 35 | 55 000 | |
| Television | 18 | 22 | 34 600 | |
| Radio | 2 | 2 | 3 100 | |
| Direct mail | 27 | 27 | 42 400 | |
| None of these | 33 | 29 | 45 600 | |
| Information sources, food, cooking and baking | Print magazines | 36 | 52 | 81 700 |
| Newspapers | 26 | 33 | 51 900 | |
| Magazine websites | 22 | 28 | 44 000 | |
| Newspaper websites | 20 | 25 | 39 300 | |
| Blogs | 14 | 19 | 29 900 | |
| Social media | 42 | 40 | 62 900 | |
| Other websites | 33 | 35 | 55 000 | |
| Television | 28 | 30 | 47 200 | |
| Radio | 6 | 5 | 7 900 | |
| Direct mail | 27 | 26 | 40 900 | |
| None of these | 12 | 8 | 12 600 | |
| Information sources, eyeglasses, contact lenses or sunglasses | Print magazines | 7 | 10 | 15 700 |
| Newspapers | 11 | 14 | 22 000 | |
| Magazine websites | 3 | 4 | 6 300 | |
| Newspaper websites | 6 | 5 | 7 900 | |
| Blogs | 1 | 1 | 1 600 | |
| Social media | 10 | 10 | 15 700 | |
| Other websites | 25 | 26 | 40 900 | |
| Television | 12 | 13 | 20 400 | |
| Radio | 2 | 1 | 1 600 | |
| Direct mail | 17 | 16 | 25 200 | |
| None of these | 52 | 50 | 78 600 | |
| Information sources, decorating and furniture purchases | Print magazines | 23 | 35 | 55 000 |
| Newspapers | 16 | 18 | 28 300 | |
| Magazine websites | 11 | 15 | 23 600 | |
| Newspaper websites | 8 | 9 | 14 100 | |
| Blogs | 8 | 9 | 14 100 | |
| Social media | 28 | 29 | 45 600 | |
| Other websites | 30 | 33 | 51 900 | |
| Television | 18 | 21 | 33 000 | |
| Radio | 2 | 1 | 1 600 | |
| Direct mail | 30 | 31 | 48 700 | |
| None of these | 26 | 19 | 29 900 | |
| Information sources, saving and investing | Print magazines | 9 | 13 | 20 400 |
| Newspapers | 11 | 15 | 23 600 | |
| Magazine websites | 7 | 8 | 12 600 | |
| Newspaper websites | 10 | 12 | 18 900 | |
| Blogs | 7 | 9 | 14 100 | |
| Social media | 18 | 15 | 23 600 | |
| Other websites | 30 | 31 | 48 700 | |
| Television | 7 | 8 | 12 600 | |
| Radio | 3 | 3 | 4 700 | |
| Direct mail | 4 | 2 | 3 100 | |
| None of these | 48 | 45 | 70 700 | |
| Information sources, health and wellbeing products / services | Print magazines | 14 | 18 | 28 300 |
| Newspapers | 14 | 17 | 26 700 | |
| Magazine websites | 8 | 10 | 15 700 | |
| Newspaper websites | 8 | 8 | 12 600 | |
| Blogs | 5 | 7 | 11 000 | |
| Social media | 23 | 22 | 34 600 | |
| Other websites | 38 | 40 | 62 900 | |
| Television | 12 | 12 | 18 900 | |
| Radio | 3 | 2 | 3 100 | |
| Direct mail | 16 | 18 | 28 300 | |
| None of these | 37 | 35 | 55 000 | |
| Information sources, purchase of sportswear, -footwear or -equipment | Print magazines | 12 | 16 | 25 200 |
| Newspapers | 18 | 22 | 34 600 | |
| Magazine websites | 7 | 9 | 14 100 | |
| Newspaper websites | 9 | 10 | 15 700 | |
| Blogs | 5 | 4 | 6 300 | |
| Social media | 24 | 21 | 33 000 | |
| Other websites | 41 | 45 | 70 700 | |
| Television | 14 | 15 | 23 600 | |
| Radio | 2 | 1 | 1 600 | |
| Direct mail | 30 | 30 | 47 200 | |
| None of these | 29 | 25 | 39 300 | Source: NRS 2024 |
| Buyer profile | All 15+ % | Magazine Readers % | Amount of readers | |
|---|---|---|---|---|
| Interests | Cars, motor vehicles | 26 | 20 | 31 400 |
| Well-being and health | 52 | 60 | 94 300 | |
| Charity work | 14 | 19 | 29 900 | |
| Self development | 32 | 37 | 58 200 | |
| Celebrities | 15 | 14 | 22 000 | |
| Fishing | 16 | 12 | 18 900 | |
| Beauty care and cosmetics | 17 | 28 | 44 000 | |
| Literature | 27 | 45 | 70 700 | |
| Domestic and foreign news | 54 | 67 | 105 300 | |
| Domestic travel | 32 | 40 | 62 900 | |
| Culture | 33 | 54 | 84 900 | |
| Crafts | 26 | 25 | 39 300 | |
| Nature and going outdoor | 53 | 57 | 89 600 | |
| Hunting | 10 | 7 | 11 000 | |
| Style and fashion | 22 | 36 | 56 600 | |
| Music and concerts | 37 | 49 | 77 000 | |
| Going on summer cottage | 30 | 33 | 51 900 | |
| Local affairs | 56 | 62 | 97 500 | |
| Computer/console/mobile playing | 17 | 9 | 14 100 | |
| Politics | 41 | 50 | 78 600 | |
| Gardening and plants | 33 | 49 | 77 000 | |
| Building and renovating | 37 | 37 | 58 200 | |
| Food and drink | 40 | 78 | 122 600 | |
| Cooking, baking, recipes | 39 | 64 | 100 600 | |
| Investment | 22 | 26 | 40 900 | |
| Decorating | 30 | 48 | 75 500 | |
| Economic and finances | 35 | 39 | 61 300 | |
| Science | 34 | 36 | 56 600 | |
| Travelling abroad | 35 | 52 | 81 700 | |
| Sports, exercising | 46 | 49 | 77 000 | |
| Sailing, boating | 10 | 10 | 15 700 | |
| Consumer electronics and information technology | 23 | 20 | 31 400 | |
| Environmental matters | 32 | 41 | 64 500 | |
| None of the above | 0 | 0 | 0 | |
| Purchases made and planned | ||||
| Planned acquisitions in the househould over the next 2 years | Building a house | 2 | 2 | 3 100 |
| Buying an apartment | 10 | 12 | 18 900 | |
| Home renovation | 29 | 31 | 48 700 | |
| Buying a car | 25 | 23 | 36 200 | |
| Buying a boat | 3 | 3 | 4 700 | |
| None of these | 50 | 50 | 78 600 | |
| Purchases in the last 12 months | Furniture and furnishings | 42 | 48 | 75 500 |
| Repair and construction products | 40 | 45 | 70 700 | |
| Domestic appliances | 38 | 43 | 67 600 | |
| Electronics or IT products | 49 | 50 | 78 600 | |
| Cars | 18 | 17 | 26 700 | |
| Clothing and footwear | 82 | 87 | 136 800 | |
| Eyeglasses, contact lenses or sunglasses | 35 | 39 | 61 300 | |
| Sports clothing, footwear or equipment | 60 | 61 | 95 900 | |
| Saving or investing products or services | 26 | 33 | 51 900 | |
| Cosmetics and beauty products | 47 | 62 | 97 500 | |
| Mobile phones | 30 | 28 | 44 000 | |
| Travels | 46 | 59 | 92 700 | |
| Products and services for health and well-being | 60 | 68 | 106 900 | |
| None of the above | 2 | 1 | 1 600 | |
| Intentions to purchase within 12 months | Furniture and furnishings | 29 | 32 | 50 300 |
| Repair and construction products | 34 | 37 | 58 200 | |
| Domestic appliances | 19 | 21 | 33 000 | |
| Electronics or IT products | 28 | 27 | 42 400 | |
| Cars | 14 | 11 | 17 300 | |
| Clothing and footwear | 64 | 68 | 106 900 | |
| Eyeglasses, contact lenses or sunglasses | 28 | 32 | 50 300 | |
| Sports clothing, footwear or equipment | 43 | 44 | 69 200 | |
| Saving or investing products or services | 21 | 29 | 45 600 | |
| Cosmetics and beauty products | 38 | 49 | 77 000 | |
| Mobile phones | 16 | 17 | 26 700 | |
| Travels | 44 | 55 | 86 500 | |
| Products and services for health and well-being | 48 | 55 | 86 500 | |
| None of the above | 7 | 5 | 7 900 | |
| Will consider switching over the next 12 months | Bank | 7 | 7 | 11 000 |
| Insurance company | 10 | 10 | 15 700 | |
| electric company | 20 | 21 | 33 000 | |
| Internet Connection | 9 | 8 | 12 600 | |
| Phone-subscription | 13 | 12 | 18 900 | |
| None of the above | 46 | 45 | 70 700 | |
| Can not say | 19 | 21 | 33 000 | |
| Uses of extra money | Magazines, books, movies | 17 | 22 | 34 600 |
| Eating, drinking, partying in a restaurant | 34 | 38 | 59 700 | |
| Exercise hobbies and equipment | 27 | 28 | 44 000 | |
| Cultural events (e.g. concerts, theater, festivals) | 35 | 47 | 73 900 | |
| Renovation, decoration | 24 | 26 | 40 900 | |
| Health services and one's own well-being | 22 | 26 | 40 900 | |
| Travelling | 42 | 54 | 84 900 | |
| Entertainment electronics and information technology equipment, mobile phones | 15 | 12 | 18 900 | |
| Clothes, shoes and bags | 23 | 26 | 40 900 | |
| Home services (cleaning and other housekeeping services) | 6 | 11 | 17 300 | |
| Car, boat, motorcycle | 12 | 8 | 12 600 | |
| Cosmetics and beauty care | 11 | 15 | 23 600 | |
| Saving, investing | 46 | 49 | 77 000 | |
| Other | 8 | 6 | 9 400 | |
| There is no extra money after mandatory expenses | 7 | 5 | 7 900 | |
| Can not say | 3 | 2 | 3 100 | Source: NRS 2024 |
Online & social media
Magazine website
Magazine in Social Media
Average weekly reach & weekly page views
The reach figures and the number of weekly pageviews are the averages of the weekly figures for each month. The weeks are determined as part of the numbers of the month in which the greater part of the days of that week fall. Figures for individual weeks can be seen on FIAM's public weekly list.
Some channels and Followers December 2024
Contact info
Media sales
- Sanoma Media Finland Oy
- yrityspalvelu@sanoma.fi
- www.sanoma.fi
- Mediamyynti Sanoma B2B
- yrityspalvelu@sanoma.fi
Media
Publisher
- Sanoma Media Finland Oy
Publisher
- Sanoma Media Finland Oy
Päätoimittaja
- Sanna Maskulin
Address
- Töölönlahdenkatu 2
- 00100 Helsinki
Postal address
- PL 25
- 00089 Sanoma
Phone
- +358 9 1201
- etu.sukunimi@sanoma.com