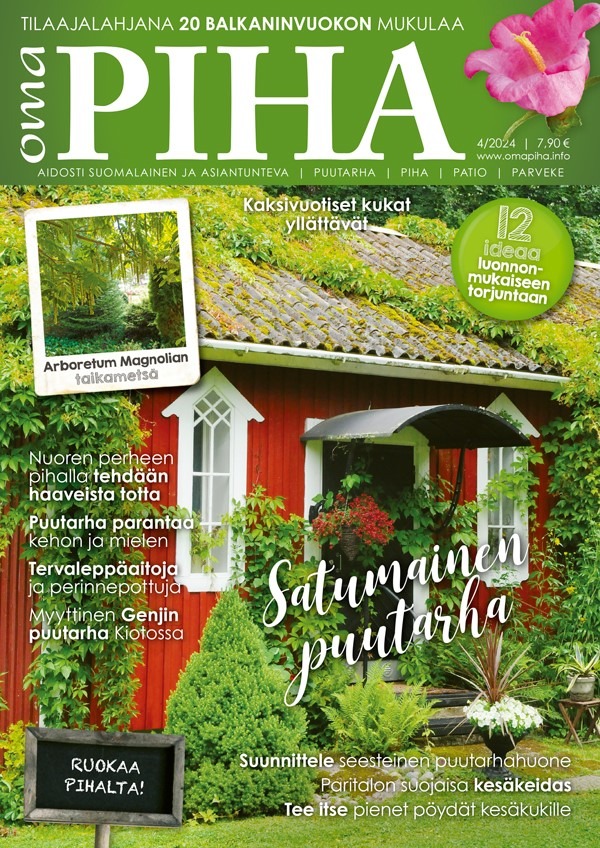
Oma PIHA
Issues per year
6 issues per year
Copies
11 000
Magazine website
Magazine in Social Media
Timetables
| Issue | Issue | Booking Date | Material Date | Themes and info |
|---|---|---|---|---|
| 1 | 9.1.2025 | 2.12.2024 | 8.12.2024 | |
| 2 | 27.2.2025 | 20.1.2025 | 3.2.2025 | |
| 3 | 24.4.2025 | 17.3.2025 | 28.3.2025 | |
| 4 | 19.6.2025 | 9.5.2025 | 26.5.2025 | |
| 5 | 14.8.2025 | 19.6.2025 | 26.6.2025 | |
| 6 | 16.10.2025 | 8.9.2025 | 22.9.2025 |
Ei aikatauluja vuodelle 2026.
Prices
| Ad | Placement | Size | Bleed | Price (tax 0%) |
|---|---|---|---|---|
| Aukeama multipage | Not specified | 420 x 297 mm *) | 4 400 € | |
| Takakansi portrait | Not specified | 210 x 265 mm *) | 2 850 € | |
| 1/1 portrait | Not specified | 210 x 297 mm *) | 2 600 € | |
| 1/2 landscape | Not specified | 210 x 148 mm *) | 1 500 € | |
| 1/2 portrait | Not specified | 102 x 297 mm *) | 1 500 € | |
| 1/3 portrait | Not specified | 70 x 297 mm *) | 1 125 € | |
| 1/4 landscape | Not specified | 184 x 66 mm *) | 900 € | |
| 1/4 portrait | Not specified | 89 x 133 mm *) | 900 € | |
| 1/6 portrait | Not specified | 58 x 133 mm *) | 675 € | |
| 1/8 landscape | Not specified | 184 x 33 mm *) | 600 € | |
| Palveluhakemisto 1 moduuli, sarjana landscape | Not specified | 40 x 60 mm *) | 100 € | *) size without marginal Prices valid until 31.12.2025 |
Size
210 x 297 mm
Printing method
Offset
Binding
Liimasidonta
Printer
PunaMusta Oy
Delivery of ad material and instructions
ilmoitukset@omapiha.info
ICC profile
Technical information
Terms of delivery
Check the delivery conditions from the publisher
| Ad | Placement | Size | Bleed | Price (tax 0%) | *) size without marginal Prices valid until 31.12.2026 |
|---|
Size
210 x 297 mm
Printing method
Offset
Binding
Liimasidonta
Printer
PunaMusta Oy
Delivery of ad material and instructions
ilmoitukset@omapiha.info
ICC profile
Technical information
Terms of delivery
Check the delivery conditions from the publisher
| Ad | Description | Size | Price (tax 0%) |
Prices valid until 31.12.2025 |
|---|
| Ad | Description | Size | Price (tax 0%) |
Prices valid until 31.12.2026 |
|---|
Readers
Readers
97 700
Total reach
114 200
How many times read
2,3
Minutes of reading
47 min
Source: NRS 2024
Gender
Source: NRS 2024
Audience in digital and print
Source: NRS 2024
Age
Source: NRS 2024
Municipality type
Source: NRS 2024
Education
Source: NRS 2024
Gross household income, daily purchases
Source: NRS 2024
NRS Facts
| Reader profile | All 15+ % | Magazine Readers % | Amount of readers | |
|---|---|---|---|---|
| Sex | Women | 51 | 70 | 68 400 |
| Men | 49 | 30 | 29 300 | |
| Native language | Finnish | 95 | 97 | 94 800 |
| Swedish | 5 | 3 | 2 900 | |
| Age | 15-24 y | 13 | 2 | 2 000 |
| 25-34 y | 14 | 4 | 3 900 | |
| 35-44 y | 14 | 7 | 6 800 | |
| 45-54 y | 14 | 13 | 12 700 | |
| 55-64 y | 16 | 22 | 21 500 | |
| 65+ y | 30 | 52 | 50 800 | |
| Gender + age | Female 15-29 years | 10 | 1 | 1 000 |
| Female 30-49 years | 14 | 11 | 10 700 | |
| Female 50+ years | 28 | 58 | 56 700 | |
| Male 15-29 years | 10 | 3 | 2 900 | |
| Male 30-49 years | 15 | 4 | 3 900 | |
| Male 50+ years | 24 | 24 | 23 400 | |
| Household position | Lives at home with parents | 7 | 1 | 1 000 |
| Lives alone | 29 | 27 | 26 400 | |
| Lives with spouse | 36 | 50 | 48 800 | |
| Lives with spouse and children | 24 | 18 | 17 600 | |
| Single parent | 3 | 2 | 2 000 | |
| Other | 3 | 2 | 2 000 | |
| Grandchildren under 18 years of age | Yes | 20 | 29 | 28 300 |
| No | 39 | 58 | 56 700 | |
| No answer (under 45 year olds) | 41 | 13 | 12 700 | |
| Education | Elementary school | 5 | 11 | 10 700 |
| Secondary school | 6 | 9 | 8 800 | |
| Vocational | 28 | 35 | 34 200 | |
| High school | 14 | 8 | 7 800 | |
| University of Applied Sciences | 20 | 13 | 12 700 | |
| University | 26 | 22 | 21 500 | |
| Something else | 2 | 3 | 2 900 | |
| Decision-maker in grocery purchases | Yes | 93 | 96 | 93 800 |
| No | 7 | 3 | 2 900 | |
| Can not say | 1 | 1 | 1 000 | |
| Use of glasses or contact lenses | Yes | 68 | 83 | 81 100 |
| No | 32 | 17 | 16 600 | |
| Size of the household | 1 pers | 29 | 26 | 25 400 |
| 2 pers | 38 | 51 | 49 800 | |
| 3 pers | 14 | 12 | 11 700 | |
| 4 pers | 12 | 8 | 7 800 | |
| 5+ pers | 7 | 3 | 2 900 | |
| Household income (gross) | Below 20 000 € /y | 11 | 8 | 7 800 |
| 20 000 - 35 000 € /y | 18 | 24 | 23 400 | |
| 35 001 - 50 000 € /y | 19 | 23 | 22 500 | |
| 50 001 - 85 000 € /y | 21 | 21 | 20 500 | |
| 85 001 - 100 000 € /y | 8 | 7 | 6 800 | |
| Over 100 000 € /y | 10 | 7 | 6 800 | |
| Dont want to tell | 5 | 7 | 6 800 | |
| Cant say / No answer | 8 | 4 | 3 900 | |
| Family with kids | Yes | 32 | 21 | 20 500 |
| No | 68 | 79 | 77 200 | |
| 13 | 11 | 10 700 | ||
| 13 | 7 | 6 800 | ||
| 5 | 2 | 2 000 | ||
| 1 | 1 | 1 000 | ||
| 1 | 0 | 0 | ||
| 68 | 78 | 76 200 | ||
| 0 | 1 | 1 000 | ||
| Pets in household | Cat | 17 | 15 | 14 700 |
| Dog | 26 | 22 | 21 500 | |
| Some other pet | 5 | 4 | 3 900 | |
| No pets | 60 | 65 | 63 500 | |
| Health services used in the household | Public health services | 85 | 87 | 85 000 |
| Employer - funded health care services | 50 | 39 | 38 100 | |
| Private, self-funded healthcare services | 38 | 45 | 44 000 | |
| Private health insurance services | 24 | 16 | 15 600 | |
| No health care | 1 | 0 | 0 | |
| Can not say | 1 | 0 | 0 | |
| Housing | Apartment | 32 | 25 | 24 400 |
| Row house or semi-detached house | 15 | 15 | 14 700 | |
| Detached house | 47 | 52 | 50 800 | |
| Farm | 5 | 5 | 4 900 | |
| Something else | 1 | 2 | 2 000 | |
| Can not say | 0 | 0 | 0 | |
| Ownership of housing | Owner-occupied residence | 77 | 83 | 81 100 |
| Rented residence | 19 | 12 | 11 700 | |
| Right of residence apartment | 2 | 4 | 3 900 | |
| Something else | 1 | 1 | 1 000 | |
| Can not say | 1 | 0 | 0 | |
| Cottage or holiday home in regular use | Yes | 41 | 45 | 44 000 |
| No | 58 | 54 | 52 800 | |
| Can not say | 1 | 0 | 0 | |
| Number of cars in household | One car | 46 | 49 | 47 900 |
| Two cars | 31 | 33 | 32 200 | |
| Three or more cars | 10 | 8 | 7 800 | |
| No car | 14 | 10 | 9 800 | |
| Type of car, if buying now | New | 21 | 25 | 24 400 |
| Used | 68 | 62 | 60 600 | |
| Company car | 4 | 2 | 2 000 | |
| Leasing (personal) | 8 | 6 | 5 900 | |
| Shared car | 3 | 1 | 1 000 | |
| Doesn't use a car | 9 | 9 | 8 800 | |
| Can not say | 5 | 5 | 4 900 | |
| Advertising ban at the door / mailbox | Yes | 26 | 14 | 13 700 |
| No | 74 | 86 | 84 000 | |
| Can not say | 0 | 0 | 0 | |
| Using AdBlocker or similar application | Yes | 19 | 8 | 7 800 |
| No | 76 | 85 | 83 000 | |
| Can not say | 5 | 7 | 6 800 | |
| Type of municipality (7 class) | Greater Helsinki | 19 | 10 | 9 800 |
| Turku or Tampere | 8 | 7 | 6 800 | |
| Oulu | 4 | 3 | 2 900 | |
| 70 000 - 150 000 inhabitants town | 13 | 13 | 12 700 | |
| Urban municipality | 27 | 32 | 31 300 | |
| Conurbation | 15 | 18 | 17 600 | |
| Countryside | 13 | 18 | 17 600 | Source: NRS 2024 |
| How often different content is read | All 15+ % | Magazine Readers % | Amount of readers | |
|---|---|---|---|---|
| The frequency of reading: Print magazines | Daily | 14 | 25 | 24 400 |
| 5-6 days a week | 4 | 6 | 5 900 | |
| 1-4 days a week | 25 | 36 | 35 200 | |
| Monthly | 24 | 23 | 22 500 | |
| Rarely | 24 | 10 | 9 800 | |
| Never | 8 | 0 | 0 | |
| Can not say | 1 | 0 | 0 | |
| The frequency of reading: Magazine content in digital format | Daily | 22 | 24 | 23 400 |
| 5-6 days a week | 6 | 5 | 4 900 | |
| 1-4 days a week | 19 | 22 | 21 500 | |
| Monthly | 15 | 12 | 11 700 | |
| Rarely | 23 | 20 | 19 500 | |
| Never | 14 | 16 | 15 600 | |
| Can not say | 1 | 2 | 2 000 | |
| The frequency of reading: Print newspapers or afternoon papers | Daily | 28 | 47 | 45 900 |
| 5-6 days a week | 4 | 6 | 5 900 | |
| 1-4 days a week | 23 | 29 | 28 300 | |
| Monthly | 14 | 9 | 8 800 | |
| Rarely | 23 | 8 | 7 800 | |
| Never | 8 | 1 | 1 000 | |
| Can not say | 1 | 0 | 0 | |
| The frequency of reading: Newspaper or afternoon paper content in digital format | Daily | 54 | 53 | 51 800 |
| 5-6 days a week | 10 | 10 | 9 800 | |
| 1-4 days a week | 16 | 15 | 14 700 | |
| Monthly | 6 | 4 | 3 900 | |
| Rarely | 9 | 8 | 7 800 | |
| Never | 6 | 10 | 9 800 | |
| Can not say | 1 | 1 | 1 000 | |
| The frequency of reading: Free and free delivery newspapers | Daily | 5 | 6 | 5 900 |
| 5-6 days a week | 4 | 6 | 5 900 | |
| 1-4 days a week | 42 | 55 | 53 700 | |
| Monthly | 18 | 15 | 14 700 | |
| Rarely | 22 | 14 | 13 700 | |
| Never | 9 | 4 | 3 900 | |
| Can not say | 1 | 0 | 0 | |
| The frequency of watching: Free online TV services | Daily | 16 | 17 | 16 600 |
| 5-6 days a week | 10 | 9 | 8 800 | |
| 1-4 days a week | 30 | 31 | 30 300 | |
| Monthly | 23 | 22 | 21 500 | |
| Rarely | 14 | 14 | 13 700 | |
| Never | 6 | 7 | 6 800 | |
| Can not say | 1 | 0 | 0 | |
| The frequency of watching: Pay TV and streaming services | Daily | 15 | 11 | 10 700 |
| 5-6 days a week | 10 | 7 | 6 800 | |
| 1-4 days a week | 22 | 16 | 15 600 | |
| Monthly | 10 | 6 | 5 900 | |
| Rarely | 12 | 13 | 12 700 | |
| Never | 30 | 48 | 46 900 | |
| Can not say | 1 | 0 | 0 | |
| The frequency of watching: Programs of YLE (national broadcaster) TV channels | Daily | 44 | 61 | 59 600 |
| 5-6 days a week | 10 | 9 | 8 800 | |
| 1-4 days a week | 20 | 15 | 14 700 | |
| Monthly | 12 | 6 | 5 900 | |
| Rarely | 11 | 6 | 5 900 | |
| Never | 3 | 2 | 2 000 | |
| Can not say | 0 | 0 | 0 | |
| The frequency of watching: Programs of commercial TV channels | Daily | 34 | 52 | 50 800 |
| 5-6 days a week | 12 | 12 | 11 700 | |
| 1-4 days a week | 23 | 16 | 15 600 | |
| Monthly | 12 | 7 | 6 800 | |
| Rarely | 13 | 7 | 6 800 | |
| Never | 6 | 7 | 6 800 | |
| Can not say | 0 | 0 | 0 | |
| The frequency of listening: Programs of YLE (national broadcaster) radio-channels | Daily | 21 | 31 | 30 300 |
| 5-6 days a week | 7 | 9 | 8 800 | |
| 1-4 days a week | 16 | 19 | 18 600 | |
| Monthly | 13 | 10 | 9 800 | |
| Rarely | 26 | 20 | 19 500 | |
| Never | 16 | 10 | 9 800 | |
| Can not say | 1 | 1 | 1 000 | |
| The frequency of listening: Programs of commercial radio channels | Daily | 16 | 20 | 19 500 |
| 5-6 days a week | 9 | 9 | 8 800 | |
| 1-4 days a week | 22 | 20 | 19 500 | |
| Monthly | 14 | 9 | 8 800 | |
| Rarely | 22 | 24 | 23 400 | |
| Never | 16 | 18 | 17 600 | |
| Can not say | 1 | 1 | 1 000 | |
| The frequency of listening: Podcasts | Daily | 5 | 2 | 2 000 |
| 5-6 days a week | 3 | 3 | 2 900 | |
| 1-4 days a week | 10 | 7 | 6 800 | |
| Monthly | 14 | 9 | 8 800 | |
| Rarely | 29 | 28 | 27 400 | |
| Never | 38 | 49 | 47 900 | |
| Can not say | 2 | 3 | 2 900 | |
| User frequency and following: Social media | Daily | 59 | 52 | 50 800 |
| 5-6 days a week | 7 | 7 | 6 800 | |
| 1-4 days a week | 7 | 8 | 7 800 | |
| Monthly | 3 | 2 | 2 000 | |
| Rarely | 6 | 7 | 6 800 | |
| Never | 17 | 24 | 23 400 | |
| Can not say | 0 | 0 | 0 | |
| User frequency and following: Bloggers, YouTubers, or social media influencers | Daily | 13 | 6 | 5 900 |
| 5-6 days a week | 6 | 3 | 2 900 | |
| 1-4 days a week | 12 | 7 | 6 800 | |
| Monthly | 8 | 6 | 5 900 | |
| Rarely | 21 | 24 | 23 400 | |
| Never | 40 | 54 | 52 800 | |
| Can not say | 1 | 0 | 0 | |
| User frequency: Instant messaging | Daily | 69 | 61 | 59 600 |
| 5-6 days a week | 10 | 11 | 10 700 | |
| 1-4 days a week | 9 | 11 | 10 700 | |
| Monthly | 3 | 4 | 3 900 | |
| Rarely | 3 | 4 | 3 900 | |
| Never | 6 | 11 | 10 700 | |
| Can not say | 0 | 0 | 0 | |
| Daily | 16 | 24 | 23 400 | |
| 5-6 days a week | 6 | 7 | 6 800 | |
| 1-4 days a week | 14 | 14 | 13 700 | |
| Monthly | 22 | 19 | 18 600 | |
| Rarely | 35 | 33 | 32 200 | |
| Never | 7 | 4 | 3 900 | |
| Can not say | 0 | 0 | 0 | |
| Daily | 3 | 3 | 2 900 | |
| 5-6 days a week | 2 | 1 | 1 000 | |
| 1-4 days a week | 4 | 3 | 2 900 | |
| Monthly | 7 | 6 | 5 900 | |
| Rarely | 30 | 26 | 25 400 | |
| Never | 53 | 60 | 58 600 | |
| Can not say | 1 | 1 | 1 000 | |
| Daily | 6 | 5 | 4 900 | |
| 5-6 days a week | 3 | 3 | 2 900 | |
| 1-4 days a week | 5 | 4 | 3 900 | |
| Monthly | 8 | 6 | 5 900 | |
| Rarely | 23 | 23 | 22 500 | |
| Never | 55 | 60 | 58 600 | |
| Can not say | 1 | 1 | 1 000 | |
| Daily | 19 | 9 | 8 800 | |
| 5-6 days a week | 9 | 7 | 6 800 | |
| 1-4 days a week | 23 | 18 | 17 600 | |
| Monthly | 22 | 24 | 23 400 | |
| Rarely | 18 | 24 | 23 400 | |
| Never | 10 | 18 | 17 600 | |
| Can not say | 0 | 0 | 0 | |
| Daily | 4 | 2 | 2 000 | |
| 5-6 days a week | 2 | 2 | 2 000 | |
| 1-4 days a week | 7 | 6 | 5 900 | |
| Monthly | 7 | 5 | 4 900 | |
| Rarely | 12 | 10 | 9 800 | |
| Never | 61 | 65 | 63 500 | |
| Cant say / No answer | 7 | 11 | 10 700 | |
| Daily | 41 | 45 | 44 000 | |
| 5-6 days a week | 8 | 8 | 7 800 | |
| 1-4 days a week | 10 | 9 | 8 800 | |
| Monthly | 6 | 4 | 3 900 | |
| Rarely | 8 | 5 | 4 900 | |
| Never | 22 | 23 | 22 500 | |
| Cant say / No answer | 4 | 7 | 6 800 | |
| Daily | 31 | 23 | 22 500 | |
| 5-6 days a week | 6 | 5 | 4 900 | |
| 1-4 days a week | 9 | 9 | 8 800 | |
| Monthly | 5 | 4 | 3 900 | |
| Rarely | 10 | 11 | 10 700 | |
| Never | 34 | 41 | 40 100 | |
| Cant say / No answer | 5 | 7 | 6 800 | |
| Daily | 14 | 4 | 3 900 | |
| 5-6 days a week | 2 | 1 | 1 000 | |
| 1-4 days a week | 3 | 1 | 1 000 | |
| Monthly | 2 | 1 | 1 000 | |
| Rarely | 5 | 6 | 5 900 | |
| Never | 69 | 80 | 78 200 | |
| Cant say / No answer | 5 | 7 | 6 800 | |
| Daily | 6 | 4 | 3 900 | |
| 5-6 days a week | 2 | 2 | 2 000 | |
| 1-4 days a week | 5 | 4 | 3 900 | |
| Monthly | 5 | 3 | 2 900 | |
| Rarely | 12 | 9 | 8 800 | |
| Never | 65 | 72 | 70 300 | |
| Cant say / No answer | 5 | 7 | 6 800 | |
| Daily | 10 | 3 | 2 900 | |
| 5-6 days a week | 3 | 2 | 2 000 | |
| 1-4 days a week | 4 | 3 | 2 900 | |
| Monthly | 3 | 3 | 2 900 | |
| Rarely | 9 | 9 | 8 800 | |
| Never | 68 | 74 | 72 300 | |
| Cant say / No answer | 5 | 7 | 6 800 | Source: NRS 2024 |
| Consumer claims | All 15+ % | Magazine Readers % | Amount of readers | |
|---|---|---|---|---|
| I enjoy shopping | Completely agree | 13 | 12 | 11 700 |
| Partially agree | 44 | 42 | 41 000 | |
| Partially disagree | 31 | 34 | 33 200 | |
| Completely disagree | 10 | 11 | 10 700 | |
| Can not say | 2 | 1 | 1 000 | |
| I prefer domestic products | Completely agree | 32 | 36 | 35 200 |
| Partially agree | 55 | 56 | 54 700 | |
| Partially disagree | 10 | 7 | 6 800 | |
| Completely disagree | 1 | 1 | 1 000 | |
| Can not say | 1 | 1 | 1 000 | |
| I consciously make responsible choices in my consumption | Completely agree | 19 | 20 | 19 500 |
| Partially agree | 55 | 61 | 59 600 | |
| Partially disagree | 19 | 15 | 14 700 | |
| Completely disagree | 4 | 3 | 2 900 | |
| Can not say | 3 | 2 | 2 000 | |
| When shopping, quality is more important to me than price | Completely agree | 22 | 24 | 23 400 |
| Partially agree | 57 | 59 | 57 600 | |
| Partially disagree | 17 | 14 | 13 700 | |
| Completely disagree | 2 | 2 | 2 000 | |
| Can not say | 2 | 2 | 2 000 | |
| I usually choose the cheapest option | Completely agree | 12 | 9 | 8 800 |
| Partially agree | 47 | 47 | 45 900 | |
| Partially disagree | 34 | 36 | 35 200 | |
| Completely disagree | 6 | 7 | 6 800 | |
| Can not say | 1 | 1 | 1 000 | |
| I often take advantage of discount and campaign prices in my purchases | Completely agree | 37 | 38 | 37 100 |
| Partially agree | 51 | 52 | 50 800 | |
| Partially disagree | 9 | 7 | 6 800 | |
| Completely disagree | 2 | 3 | 2 900 | |
| Can not say | 1 | 0 | 0 | |
| In my circle of friends, I am often the first to try new things | Completely agree | 6 | 5 | 4 900 |
| Partially agree | 25 | 21 | 20 500 | |
| Partially disagree | 38 | 43 | 42 000 | |
| Completely disagree | 24 | 25 | 24 400 | |
| Can not say | 7 | 7 | 6 800 | |
| In my opinion, money is for consumption and not for saving | Completely agree | 5 | 5 | 4 900 |
| Partially agree | 35 | 35 | 34 200 | |
| Partially disagree | 46 | 47 | 45 900 | |
| Completely disagree | 11 | 10 | 9 800 | |
| Can not say | 3 | 3 | 2 900 | |
| I prefer local shops and services | Completely agree | 27 | 35 | 34 200 |
| Partially agree | 57 | 56 | 54 700 | |
| Partially disagree | 12 | 8 | 7 800 | |
| Completely disagree | 2 | 1 | 1 000 | |
| Can not say | 2 | 1 | 1 000 | |
| I want to see advertising targeted to me based on my online behavior | Completely agree | 4 | 3 | 2 900 |
| Partially agree | 28 | 26 | 25 400 | |
| Partially disagree | 31 | 29 | 28 300 | |
| Completely disagree | 32 | 35 | 34 200 | |
| Can not say | 5 | 7 | 6 800 | |
| When I want a certain brand of product, the price doesn't matter | Completely agree | 9 | 9 | 8 800 |
| Partially agree | 32 | 33 | 32 200 | |
| Partially disagree | 37 | 38 | 37 100 | |
| Completely disagree | 22 | 19 | 18 600 | |
| Can not say | 2 | 1 | 1 000 | |
| I prefer certified products in my purchases (e.g. Fairtrade, The Nordic Swan Ecolabel, Avainlippu) | Completely agree | 17 | 19 | 18 600 |
| Partially agree | 50 | 57 | 55 700 | |
| Partially disagree | 24 | 18 | 17 600 | |
| Completely disagree | 6 | 4 | 3 900 | |
| Can not say | 3 | 2 | 2 000 | |
| Ecology is an important purchase reason for me | Completely agree | 16 | 19 | 18 600 |
| Partially agree | 51 | 53 | 51 800 | |
| Partially disagree | 24 | 20 | 19 500 | |
| Completely disagree | 7 | 4 | 3 900 | |
| Can not say | 3 | 3 | 2 900 | |
| I prefer well-known brands | Completely agree | 12 | 10 | 9 800 |
| Partially agree | 57 | 62 | 60 600 | |
| Partially disagree | 23 | 22 | 21 500 | |
| Completely disagree | 5 | 4 | 3 900 | |
| Can not say | 3 | 2 | 2 000 | Source: NRS 2024 |
| Attitude towards advertising in different media channels | All 15+ % | Magazine Readers % | Amount of readers | |
|---|---|---|---|---|
| Newspapers | Very positive | 13 | 15 | 14 700 |
| Quite positively | 63 | 68 | 66 400 | |
| Quite negatively | 15 | 13 | 12 700 | |
| Very negative | 4 | 2 | 2 000 | |
| Can not say | 5 | 3 | 2 900 | |
| Magazines | Very positive | 14 | 14 | 13 700 |
| Quite positively | 61 | 65 | 63 500 | |
| Quite negatively | 16 | 16 | 15 600 | |
| Very negative | 4 | 2 | 2 000 | |
| Can not say | 6 | 3 | 2 900 | |
| Free and local newspapers | Very positive | 24 | 28 | 27 400 |
| Quite positively | 57 | 60 | 58 600 | |
| Quite negatively | 10 | 8 | 7 800 | |
| Very negative | 3 | 2 | 2 000 | |
| Can not say | 5 | 3 | 2 900 | |
| Newspaper/Magazine websites or applications | Very positive | 7 | 7 | 6 800 |
| Quite positively | 47 | 44 | 43 000 | |
| Quite negatively | 28 | 27 | 26 400 | |
| Very negative | 9 | 7 | 6 800 | |
| Can not say | 8 | 15 | 14 700 | |
| Social media (Facebook, Instagram etc.) | Very positive | 6 | 7 | 6 800 |
| Quite positively | 34 | 34 | 33 200 | |
| Quite negatively | 32 | 28 | 27 400 | |
| Very negative | 16 | 15 | 14 700 | |
| Can not say | 13 | 17 | 16 600 | |
| Blogs | Very positive | 4 | 4 | 3 900 |
| Quite positively | 27 | 23 | 22 500 | |
| Quite negatively | 28 | 25 | 24 400 | |
| Very negative | 15 | 13 | 12 700 | |
| Can not say | 27 | 35 | 34 200 | |
| Newsletters to email | Very positive | 2 | 2 | 2 000 |
| Quite positively | 18 | 19 | 18 600 | |
| Quite negatively | 34 | 41 | 40 100 | |
| Very negative | 43 | 34 | 33 200 | |
| Can not say | 3 | 3 | 2 900 | |
| Other websites | Very positive | 4 | 4 | 3 900 |
| Quite positively | 39 | 38 | 37 100 | |
| Quite negatively | 33 | 30 | 29 300 | |
| Very negative | 13 | 12 | 11 700 | |
| Can not say | 11 | 16 | 15 600 | |
| Commercial TV channels (MTV3, Nelonen, Sub, FOX etc.) | Very positive | 9 | 11 | 10 700 |
| Quite positively | 48 | 48 | 46 900 | |
| Quite negatively | 28 | 27 | 26 400 | |
| Very negative | 13 | 11 | 10 700 | |
| Can not say | 4 | 3 | 2 900 | |
| Commercial radio channels (Radio Nova, SuomiPOP, NRJ, Iskelmä etc.) | Very positive | 5 | 6 | 5 900 |
| Quite positively | 36 | 36 | 35 200 | |
| Quite negatively | 33 | 36 | 35 200 | |
| Very negative | 19 | 17 | 16 600 | |
| Can not say | 6 | 5 | 4 900 | |
| Home delivered advertisements and catalogues | Very positive | 20 | 26 | 25 400 |
| Quite positively | 47 | 52 | 50 800 | |
| Quite negatively | 16 | 12 | 11 700 | |
| Very negative | 13 | 8 | 7 800 | |
| Can not say | 4 | 2 | 2 000 | |
| Out-of-home advertising | Very positive | 12 | 12 | 11 700 |
| Quite positively | 53 | 52 | 50 800 | |
| Quite negatively | 20 | 21 | 20 500 | |
| Very negative | 7 | 7 | 6 800 | |
| Can not say | 7 | 8 | 7 800 | Source: NRS 2024 |
| Reading device and advertising effect | All 15+ % | Magazine Readers % | Amount of readers | |
|---|---|---|---|---|
| I relax and get inspired by magazines | Completely agree | 17 | 21 | 20 500 |
| Partially agree | 61 | 64 | 62 500 | |
| Partially disagree | 11 | 10 | 9 800 | |
| Completely disagree | 4 | 2 | 2 000 | |
| Can not say | 7 | 3 | 2 900 | |
| Completely agree | 17 | 19 | 18 600 | |
| Partially agree | 58 | 62 | 60 600 | |
| Partially disagree | 14 | 13 | 12 700 | |
| Completely disagree | 5 | 3 | 2 900 | |
| Can not say | 7 | 4 | 3 900 | |
| A professional magazine keeps me up to date on professional matters | Completely agree | 22 | 22 | 21 500 |
| Partially agree | 48 | 49 | 47 900 | |
| Partially disagree | 12 | 11 | 10 700 | |
| Completely disagree | 5 | 4 | 3 900 | |
| Can not say | 13 | 14 | 13 700 | |
| The industry specialty magazine provides information on my hobbies and interests | Completely agree | 31 | 33 | 32 200 |
| Partially agree | 50 | 52 | 50 800 | |
| Partially disagree | 7 | 6 | 5 900 | |
| Completely disagree | 3 | 2 | 2 000 | |
| Can not say | 9 | 8 | 7 800 | |
| Finnish magazines offer reliable comparisons and tests | Completely agree | 16 | 15 | 14 700 |
| Partially agree | 52 | 55 | 53 700 | |
| Partially disagree | 14 | 12 | 11 700 | |
| Completely disagree | 3 | 2 | 2 000 | |
| Can not say | 15 | 16 | 15 600 | |
| Finnish magazines offer reliable product recommendations | Completely agree | 10 | 11 | 10 700 |
| Partially agree | 54 | 55 | 53 700 | |
| Partially disagree | 18 | 18 | 17 600 | |
| Completely disagree | 3 | 2 | 2 000 | |
| Can not say | 15 | 14 | 13 700 | |
| Finnish magazines are of high quality | Completely agree | 22 | 27 | 26 400 |
| Partially agree | 59 | 62 | 60 600 | |
| Partially disagree | 9 | 7 | 6 800 | |
| Completely disagree | 2 | 1 | 1 000 | |
| Can not say | 8 | 4 | 3 900 | |
| I follow important magazines on social media | Completely agree | 7 | 6 | 5 900 |
| Partially agree | 25 | 24 | 23 400 | |
| Partially disagree | 25 | 29 | 28 300 | |
| Completely disagree | 34 | 34 | 33 200 | |
| Can not say | 9 | 6 | 5 900 | |
| I read important magazines from cover to cover | Completely agree | 18 | 24 | 23 400 |
| Partially agree | 34 | 40 | 39 100 | |
| Partially disagree | 28 | 22 | 21 500 | |
| Completely disagree | 16 | 11 | 10 700 | |
| Can not say | 5 | 3 | 2 900 | |
| Ads in magazines make new things familiar | Completely agree | 10 | 13 | 12 700 |
| Partially agree | 50 | 54 | 52 800 | |
| Partially disagree | 24 | 22 | 21 500 | |
| Completely disagree | 8 | 7 | 6 800 | |
| Can not say | 8 | 4 | 3 900 | |
| Completely agree | 10 | 12 | 11 700 | |
| Partially agree | 36 | 33 | 32 200 | |
| Partially disagree | 24 | 24 | 23 400 | |
| Completely disagree | 23 | 25 | 24 400 | |
| Can not say | 8 | 6 | 5 900 | |
| I have purchased products based on the ad in magazine | Completely agree | 9 | 13 | 12 700 |
| Partially agree | 36 | 37 | 36 100 | |
| Partially disagree | 26 | 28 | 27 400 | |
| Completely disagree | 22 | 20 | 19 500 | |
| Can not say | 6 | 3 | 2 900 | |
| I'm trying out tips or guidelines (like recipes) in magazine ads | Completely agree | 13 | 15 | 14 700 |
| Partially agree | 49 | 55 | 53 700 | |
| Partially disagree | 20 | 17 | 16 600 | |
| Completely disagree | 13 | 12 | 11 700 | |
| Can not say | 5 | 2 | 2 000 | |
| I'm experimenting with product samples in magazines (like food or cosmetics) | Completely agree | 9 | 9 | 8 800 |
| Partially agree | 29 | 38 | 37 100 | |
| Partially disagree | 29 | 24 | 23 400 | |
| Completely disagree | 27 | 26 | 25 400 | |
| Can not say | 6 | 3 | 2 900 | |
| Completely agree | 2 | 1 | 1 000 | |
| Partially agree | 19 | 11 | 10 700 | |
| Partially disagree | 33 | 31 | 30 300 | |
| Completely disagree | 38 | 46 | 44 900 | |
| Can not say | 9 | 11 | 10 700 | |
| Completely agree | 16 | 22 | 21 500 | |
| Partially agree | 40 | 47 | 45 900 | |
| Partially disagree | 23 | 19 | 18 600 | |
| Completely disagree | 12 | 7 | 6 800 | |
| Can not say | 8 | 5 | 4 900 | Source: NRS 2024 |
| Use of information sources during the purchase process | All 15+ % | Magazine Readers % | Amount of readers | |
|---|---|---|---|---|
| Information sources, cars and car purchase | Print magazines | 11 | 13 | 12 700 |
| Newspapers | 13 | 20 | 19 500 | |
| Magazine websites | 7 | 6 | 5 900 | |
| Newspaper websites | 8 | 6 | 5 900 | |
| Blogs | 3 | 1 | 1 000 | |
| Social media | 14 | 9 | 8 800 | |
| Other websites | 42 | 35 | 34 200 | |
| Television | 10 | 14 | 13 700 | |
| Radio | 2 | 1 | 1 000 | |
| Direct mail | 10 | 14 | 13 700 | |
| None of these | 40 | 40 | 39 100 | |
| Information sources, consumer electronics and information technology | Print magazines | 15 | 20 | 19 500 |
| Newspapers | 18 | 25 | 24 400 | |
| Magazine websites | 10 | 7 | 6 800 | |
| Newspaper websites | 11 | 7 | 6 800 | |
| Blogs | 6 | 3 | 2 900 | |
| Social media | 26 | 15 | 14 700 | |
| Other websites | 49 | 40 | 39 100 | |
| Television | 17 | 24 | 23 400 | |
| Radio | 3 | 2 | 2 000 | |
| Direct mail | 36 | 49 | 47 900 | |
| None of these | 17 | 17 | 16 600 | |
| Information sources, beauty care and cosmetics | Print magazines | 18 | 31 | 30 300 |
| Newspapers | 8 | 14 | 13 700 | |
| Magazine websites | 10 | 12 | 11 700 | |
| Newspaper websites | 6 | 6 | 5 900 | |
| Blogs | 8 | 5 | 4 900 | |
| Social media | 28 | 21 | 20 500 | |
| Other websites | 16 | 18 | 17 600 | |
| Television | 14 | 22 | 21 500 | |
| Radio | 2 | 1 | 1 000 | |
| Direct mail | 17 | 26 | 25 400 | |
| None of these | 45 | 36 | 35 200 | |
| Information sources, travel | Print magazines | 16 | 25 | 24 400 |
| Newspapers | 15 | 25 | 24 400 | |
| Magazine websites | 10 | 9 | 8 800 | |
| Newspaper websites | 10 | 7 | 6 800 | |
| Blogs | 11 | 8 | 7 800 | |
| Social media | 34 | 26 | 25 400 | |
| Other websites | 47 | 48 | 46 900 | |
| Television | 16 | 22 | 21 500 | |
| Radio | 3 | 3 | 2 900 | |
| Direct mail | 9 | 14 | 13 700 | |
| None of these | 27 | 23 | 22 500 | |
| Information sources, style and fashion | Print magazines | 23 | 38 | 37 100 |
| Newspapers | 13 | 21 | 20 500 | |
| Magazine websites | 13 | 14 | 13 700 | |
| Newspaper websites | 8 | 7 | 6 800 | |
| Blogs | 9 | 6 | 5 900 | |
| Social media | 34 | 24 | 23 400 | |
| Other websites | 33 | 33 | 32 200 | |
| Television | 18 | 25 | 24 400 | |
| Radio | 2 | 1 | 1 000 | |
| Direct mail | 25 | 39 | 38 100 | |
| None of these | 29 | 21 | 20 500 | |
| Information sources, building and renovating | Print magazines | 19 | 27 | 26 400 |
| Newspapers | 15 | 23 | 22 500 | |
| Magazine websites | 9 | 8 | 7 800 | |
| Newspaper websites | 8 | 7 | 6 800 | |
| Blogs | 6 | 3 | 2 900 | |
| Social media | 23 | 15 | 14 700 | |
| Other websites | 32 | 28 | 27 400 | |
| Television | 18 | 22 | 21 500 | |
| Radio | 2 | 1 | 1 000 | |
| Direct mail | 27 | 41 | 40 100 | |
| None of these | 33 | 28 | 27 400 | |
| Information sources, food, cooking and baking | Print magazines | 36 | 50 | 48 800 |
| Newspapers | 26 | 38 | 37 100 | |
| Magazine websites | 22 | 22 | 21 500 | |
| Newspaper websites | 20 | 15 | 14 700 | |
| Blogs | 14 | 9 | 8 800 | |
| Social media | 42 | 30 | 29 300 | |
| Other websites | 33 | 29 | 28 300 | |
| Television | 28 | 35 | 34 200 | |
| Radio | 6 | 7 | 6 800 | |
| Direct mail | 27 | 39 | 38 100 | |
| None of these | 12 | 9 | 8 800 | |
| Information sources, eyeglasses, contact lenses or sunglasses | Print magazines | 7 | 10 | 9 800 |
| Newspapers | 11 | 19 | 18 600 | |
| Magazine websites | 3 | 4 | 3 900 | |
| Newspaper websites | 6 | 5 | 4 900 | |
| Blogs | 1 | 0 | 0 | |
| Social media | 10 | 11 | 10 700 | |
| Other websites | 25 | 25 | 24 400 | |
| Television | 12 | 19 | 18 600 | |
| Radio | 2 | 1 | 1 000 | |
| Direct mail | 17 | 28 | 27 400 | |
| None of these | 52 | 42 | 41 000 | |
| Information sources, decorating and furniture purchases | Print magazines | 23 | 35 | 34 200 |
| Newspapers | 16 | 23 | 22 500 | |
| Magazine websites | 11 | 10 | 9 800 | |
| Newspaper websites | 8 | 7 | 6 800 | |
| Blogs | 8 | 4 | 3 900 | |
| Social media | 28 | 18 | 17 600 | |
| Other websites | 30 | 27 | 26 400 | |
| Television | 18 | 25 | 24 400 | |
| Radio | 2 | 1 | 1 000 | |
| Direct mail | 30 | 46 | 44 900 | |
| None of these | 26 | 20 | 19 500 | |
| Information sources, saving and investing | Print magazines | 9 | 9 | 8 800 |
| Newspapers | 11 | 16 | 15 600 | |
| Magazine websites | 7 | 5 | 4 900 | |
| Newspaper websites | 10 | 7 | 6 800 | |
| Blogs | 7 | 3 | 2 900 | |
| Social media | 18 | 10 | 9 800 | |
| Other websites | 30 | 24 | 23 400 | |
| Television | 7 | 11 | 10 700 | |
| Radio | 3 | 2 | 2 000 | |
| Direct mail | 4 | 6 | 5 900 | |
| None of these | 48 | 52 | 50 800 | |
| Information sources, health and wellbeing products / services | Print magazines | 14 | 20 | 19 500 |
| Newspapers | 14 | 22 | 21 500 | |
| Magazine websites | 8 | 8 | 7 800 | |
| Newspaper websites | 8 | 7 | 6 800 | |
| Blogs | 5 | 4 | 3 900 | |
| Social media | 23 | 20 | 19 500 | |
| Other websites | 38 | 37 | 36 100 | |
| Television | 12 | 15 | 14 700 | |
| Radio | 3 | 2 | 2 000 | |
| Direct mail | 16 | 25 | 24 400 | |
| None of these | 37 | 33 | 32 200 | |
| Information sources, purchase of sportswear, -footwear or -equipment | Print magazines | 12 | 17 | 16 600 |
| Newspapers | 18 | 29 | 28 300 | |
| Magazine websites | 7 | 6 | 5 900 | |
| Newspaper websites | 9 | 10 | 9 800 | |
| Blogs | 5 | 2 | 2 000 | |
| Social media | 24 | 16 | 15 600 | |
| Other websites | 41 | 35 | 34 200 | |
| Television | 14 | 21 | 20 500 | |
| Radio | 2 | 1 | 1 000 | |
| Direct mail | 30 | 41 | 40 100 | |
| None of these | 29 | 26 | 25 400 | Source: NRS 2024 |
| Buyer profile | All 15+ % | Magazine Readers % | Amount of readers | |
|---|---|---|---|---|
| Interests | Cars, motor vehicles | 26 | 21 | 20 500 |
| Well-being and health | 52 | 63 | 61 600 | |
| Charity work | 14 | 19 | 18 600 | |
| Self development | 32 | 35 | 34 200 | |
| Celebrities | 15 | 13 | 12 700 | |
| Fishing | 16 | 15 | 14 700 | |
| Beauty care and cosmetics | 17 | 18 | 17 600 | |
| Literature | 27 | 34 | 33 200 | |
| Domestic and foreign news | 54 | 52 | 50 800 | |
| Domestic travel | 32 | 35 | 34 200 | |
| Culture | 33 | 38 | 37 100 | |
| Crafts | 26 | 42 | 41 000 | |
| Nature and going outdoor | 53 | 64 | 62 500 | |
| Hunting | 10 | 9 | 8 800 | |
| Style and fashion | 22 | 26 | 25 400 | |
| Music and concerts | 37 | 35 | 34 200 | |
| Going on summer cottage | 30 | 40 | 39 100 | |
| Local affairs | 56 | 60 | 58 600 | |
| Computer/console/mobile playing | 17 | 4 | 3 900 | |
| Politics | 41 | 36 | 35 200 | |
| Gardening and plants | 33 | 71 | 69 400 | |
| Building and renovating | 37 | 43 | 42 000 | |
| Food and drink | 40 | 39 | 38 100 | |
| Cooking, baking, recipes | 39 | 50 | 48 800 | |
| Investment | 22 | 21 | 20 500 | |
| Decorating | 30 | 47 | 45 900 | |
| Economic and finances | 35 | 32 | 31 300 | |
| Science | 34 | 27 | 26 400 | |
| Travelling abroad | 35 | 33 | 32 200 | |
| Sports, exercising | 46 | 40 | 39 100 | |
| Sailing, boating | 10 | 8 | 7 800 | |
| Consumer electronics and information technology | 23 | 11 | 10 700 | |
| Environmental matters | 32 | 38 | 37 100 | |
| None of the above | 0 | 0 | 0 | |
| Purchases made and planned | ||||
| Planned acquisitions in the househould over the next 2 years | Building a house | 2 | 1 | 1 000 |
| Buying an apartment | 10 | 6 | 5 900 | |
| Home renovation | 29 | 26 | 25 400 | |
| Buying a car | 25 | 19 | 18 600 | |
| Buying a boat | 3 | 2 | 2 000 | |
| None of these | 50 | 58 | 56 700 | |
| Purchases in the last 12 months | Furniture and furnishings | 42 | 36 | 35 200 |
| Repair and construction products | 40 | 41 | 40 100 | |
| Domestic appliances | 38 | 40 | 39 100 | |
| Electronics or IT products | 49 | 41 | 40 100 | |
| Cars | 18 | 12 | 11 700 | |
| Clothing and footwear | 82 | 84 | 82 100 | |
| Eyeglasses, contact lenses or sunglasses | 35 | 39 | 38 100 | |
| Sports clothing, footwear or equipment | 60 | 55 | 53 700 | |
| Saving or investing products or services | 26 | 23 | 22 500 | |
| Cosmetics and beauty products | 47 | 58 | 56 700 | |
| Mobile phones | 30 | 25 | 24 400 | |
| Travels | 46 | 45 | 44 000 | |
| Products and services for health and well-being | 60 | 66 | 64 500 | |
| None of the above | 2 | 1 | 1 000 | |
| Intentions to purchase within 12 months | Furniture and furnishings | 29 | 21 | 20 500 |
| Repair and construction products | 34 | 32 | 31 300 | |
| Domestic appliances | 19 | 17 | 16 600 | |
| Electronics or IT products | 28 | 20 | 19 500 | |
| Cars | 14 | 11 | 10 700 | |
| Clothing and footwear | 64 | 62 | 60 600 | |
| Eyeglasses, contact lenses or sunglasses | 28 | 33 | 32 200 | |
| Sports clothing, footwear or equipment | 43 | 35 | 34 200 | |
| Saving or investing products or services | 21 | 16 | 15 600 | |
| Cosmetics and beauty products | 38 | 40 | 39 100 | |
| Mobile phones | 16 | 16 | 15 600 | |
| Travels | 44 | 41 | 40 100 | |
| Products and services for health and well-being | 48 | 49 | 47 900 | |
| None of the above | 7 | 6 | 5 900 | |
| Will consider switching over the next 12 months | Bank | 7 | 5 | 4 900 |
| Insurance company | 10 | 5 | 4 900 | |
| electric company | 20 | 18 | 17 600 | |
| Internet Connection | 9 | 6 | 5 900 | |
| Phone-subscription | 13 | 8 | 7 800 | |
| None of the above | 46 | 56 | 54 700 | |
| Can not say | 19 | 17 | 16 600 | |
| Uses of extra money | Magazines, books, movies | 17 | 18 | 17 600 |
| Eating, drinking, partying in a restaurant | 34 | 25 | 24 400 | |
| Exercise hobbies and equipment | 27 | 24 | 23 400 | |
| Cultural events (e.g. concerts, theater, festivals) | 35 | 36 | 35 200 | |
| Renovation, decoration | 24 | 24 | 23 400 | |
| Health services and one's own well-being | 22 | 29 | 28 300 | |
| Travelling | 42 | 43 | 42 000 | |
| Entertainment electronics and information technology equipment, mobile phones | 15 | 7 | 6 800 | |
| Clothes, shoes and bags | 23 | 18 | 17 600 | |
| Home services (cleaning and other housekeeping services) | 6 | 9 | 8 800 | |
| Car, boat, motorcycle | 12 | 9 | 8 800 | |
| Cosmetics and beauty care | 11 | 10 | 9 800 | |
| Saving, investing | 46 | 42 | 41 000 | |
| Other | 8 | 7 | 6 800 | |
| There is no extra money after mandatory expenses | 7 | 6 | 5 900 | |
| Can not say | 3 | 3 | 2 900 | Source: NRS 2024 |
Online & social media
Magazine website
Magazine in Social Media
Some channels and Followers December 2024
Contact info
Media sales
- Saarsalo Oy
- Myllyhaantie 6 C
- 33960 Pirkkala
- info@saarsalo.fi
- www.saarsalo.fi
Myyntipäällikkö
- Sanna Mäkinen
- 041 313 2706
- sanna.makinen@saarsalo.fi
Media
Publisher
- Pellervo-Media Oy
Publisher
- Pellervo-Media Oy
Vastaava päätoimittaja
- Anna Malk
Address
- Simonkatu 6
- 00100 Helsinki
Postal address
- PL 77
- 00101 Helsinki