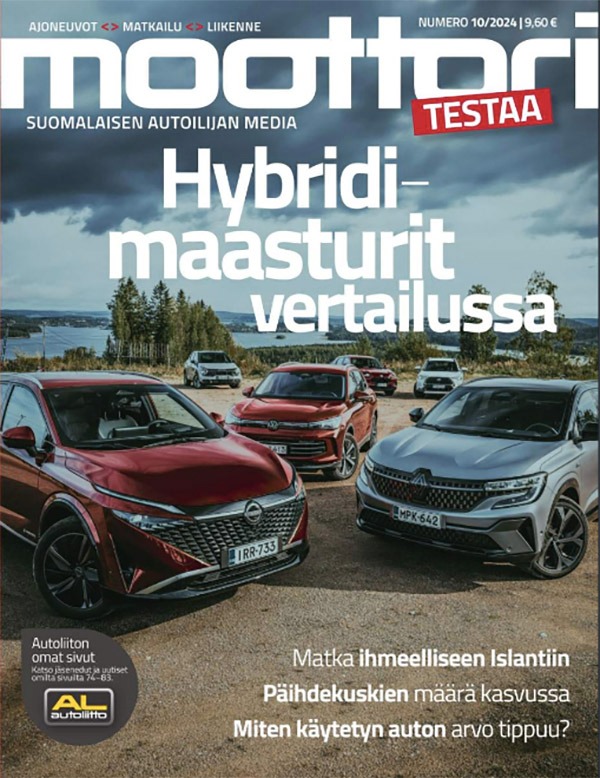
Moottori
Moottori is the member magazine of the Finnish Touring Club and the biggest car magazine in Finland. In every issue there are reports of the new cars, interesting travel destinations, detailed articles about the Finnish traffic policy and current motoring trends.
Issues per year
9 issues per year
Copies
114 000
Magazine website
Magazine in Social Media
Timetables
| Issue | Issue | Booking Date | Material Date | Themes and info |
|---|---|---|---|---|
| 1 - 2 | 29.1.2025 | 10.1.2025 | 14.1.2025 | Motorcycles. Winter vacation and safety. Travelling. New and used cars. |
| 3 | 5.3.2025 | 14.2.2025 | 18.2.2025 | Summer tyre test. Camper vans. Travelling. New and used cars. |
| 4 | 9.4.2025 | 21.3.2025 | 25.3.2025 | Summer tyre test. Travelling. New and used cars. |
| 5 | 14.5.2025 | 25.4.2025 | 29.4.2025 | Electric bicycles. Travelling. New and used cars. |
| 6 - 7 | 18.6.2025 | 30.5.2025 | 3.6.2025 | Costs of motoring. Travelling. New and used cars. |
| 8 | 13.8.2025 | 25.7.2025 | 29.7.2025 | Car comparison test. Travelling. New and used cars. |
| 9 | 10.9.2025 | 22.8.2025 | 26.8.2025 | Winter tyre test. Travelling. New and used cars. |
| 10 | 15.10.2025 | 26.9.2025 | 30.9.2025 | Car releases 2026. Travelling. New and used cars. |
| 11 - 12 | 26.11.2025 | 7.11.2025 | 11.11.2025 | Travelling extra. Long test end report. New and used cars. |
Ei aikatauluja vuodelle 2026.
Prices
| Ad | Placement | Size | Bleed | Price (tax 0%) |
|---|---|---|---|---|
| 2/1 landscape | First spread | 420 x 275 mm | 5 mm | 11 800 € |
| 2/1 landscape | Not specified | 420 x 275 mm | 5 mm | 10 160 € |
| takakansi portrait | Back cover | 210 x 250 mm | 5 mm | 5 590 € |
| 2.kansi portrait | 2. Cover | 210 x 275 mm | 5 mm | 5 390 € |
| 3.kansi portrait | 3. Cover | 210 x 275 mm | 5 mm | 5 290 € |
| 1/1 portrait | Not specified | 210 x 275 mm | 5 mm | 5 080 € |
| 1/2 portrait | Not specified | 105 x 275 mm | 5 mm | 3 050 € |
| 1/2 portrait | Not specified | 105 x 275 mm | 5 mm | 3 050 € |
| 1/3 landscape | Not specified | 210 x 90 mm | 5 mm | 2 610 € |
| 1/3 portrait | Not specified | 70 x 275 mm | 5 mm | 2 610 € |
| 1/4 landscape | Not specified | 210 x 65 mm | 5 mm | 2 030 € | *) size without marginal Prices valid until 31.12.2025 |
Size
210 x 275 mm
Printing method
Offset
Binding
Liimasidonta
Printer
PunaMusta Oy
Delivery of ad material and instructions
ICC profile
Technical information
Ilmoitusaineistot / Advertising materials: ads.aikakausmedia.fi
Terms of delivery
Check the delivery conditions from the publisher
| Ad | Placement | Size | Bleed | Price (tax 0%) | *) size without marginal Prices valid until 31.12.2026 |
|---|
Size
210 x 275 mm
Printing method
Offset
Binding
Liimasidonta
Printer
PunaMusta Oy
Delivery of ad material and instructions
ICC profile
Technical information
Ilmoitusaineistot / Advertising materials: ads.aikakausmedia.fi
Terms of delivery
Check the delivery conditions from the publisher
| Ad | Description | Size | Price (tax 0%) |
|---|---|---|---|
| Desktop | 980x552 px | 35 € / CPM (Cost per thousand) | |
| Desktop | 980x400 px | 30 € / CPM (Cost per thousand) | |
| Desktop | 980x120 px | 12 € / CPM (Cost per thousand) | |
| Desktop | 140x350 px | 6 € / CPM (Cost per thousand) | |
| Desktop | 160x600 px | 8 € / CPM (Cost per thousand) | |
| Desktop | 200x900 px | 9 € / CPM (Cost per thousand) | |
| Desktop | 468x400 px | 9 € / CPM (Cost per thousand) | |
| Desktop | 468x600 px | 12 € / CPM (Cost per thousand) | |
| Desktop | 300x250 px | 7 € / CPM (Cost per thousand) | |
| Mobile | 300x300 px | 18 € / CPM (Cost per thousand) | |
| Mobile | 300x150 px | 12 € / CPM (Cost per thousand) | |
| Desktop | Digietusivu | 600x700 px | 40 € / CPM (Cost per thousand) |
| Desktop | Videoetusivu (valmistus 95 €) | 600x700 px | 40 € / CPM (Cost per thousand) |
| Desktop | Videoparaati | 980x400 px | 30 € / CPM (Cost per thousand) |
| Desktop | Videojättiboksi | 468x400 px | 10 € / CPM (Cost per thousand) | Prices valid until 31.12.2025 |
| Ad | Description | Size | Price (tax 0%) |
Prices valid until 31.12.2026 |
|---|
Readers
Readers
242 500
Total reach
295 800
How many times read
1,9
Minutes of reading
55 min
Source: NRS 2024
Gender
Source: NRS 2024
Audience in digital and print
Source: NRS 2024
Age
Source: NRS 2024
Municipality type
Source: NRS 2024
Education
Source: NRS 2024
Gross household income, daily purchases
Source: NRS 2024
NRS Facts
| Reader profile | All 15+ % | Magazine Readers % | Amount of readers | |
|---|---|---|---|---|
| Sex | Women | 51 | 15 | 36 400 |
| Men | 49 | 85 | 206 100 | |
| Native language | Finnish | 95 | 97 | 235 200 |
| Swedish | 5 | 3 | 7 300 | |
| Age | 15-24 y | 13 | 5 | 12 100 |
| 25-34 y | 14 | 8 | 19 400 | |
| 35-44 y | 14 | 12 | 29 100 | |
| 45-54 y | 14 | 16 | 38 800 | |
| 55-64 y | 16 | 22 | 53 400 | |
| 65+ y | 30 | 36 | 87 300 | |
| Gender + age | Female 15-29 years | 10 | 1 | 2 400 |
| Female 30-49 years | 14 | 4 | 9 700 | |
| Female 50+ years | 28 | 10 | 24 200 | |
| Male 15-29 years | 10 | 7 | 17 000 | |
| Male 30-49 years | 15 | 22 | 53 400 | |
| Male 50+ years | 24 | 56 | 135 800 | |
| Household position | Lives at home with parents | 7 | 3 | 7 300 |
| Lives alone | 29 | 24 | 58 200 | |
| Lives with spouse | 36 | 44 | 106 700 | |
| Lives with spouse and children | 24 | 26 | 63 000 | |
| Single parent | 3 | 2 | 4 800 | |
| Other | 3 | 2 | 4 800 | |
| Grandchildren under 18 years of age | Yes | 20 | 26 | 63 000 |
| No | 39 | 49 | 118 800 | |
| No answer (under 45 year olds) | 41 | 26 | 63 000 | |
| Education | Elementary school | 5 | 6 | 14 600 |
| Secondary school | 6 | 4 | 9 700 | |
| Vocational | 28 | 35 | 84 900 | |
| High school | 14 | 9 | 21 800 | |
| University of Applied Sciences | 20 | 18 | 43 600 | |
| University | 26 | 26 | 63 000 | |
| Something else | 2 | 2 | 4 800 | |
| Decision-maker in grocery purchases | Yes | 93 | 90 | 218 200 |
| No | 7 | 9 | 21 800 | |
| Can not say | 1 | 1 | 2 400 | |
| Use of glasses or contact lenses | Yes | 68 | 70 | 169 800 |
| No | 32 | 30 | 72 800 | |
| Size of the household | 1 pers | 29 | 22 | 53 400 |
| 2 pers | 38 | 47 | 114 000 | |
| 3 pers | 14 | 15 | 36 400 | |
| 4 pers | 12 | 12 | 29 100 | |
| 5+ pers | 7 | 5 | 12 100 | |
| Household income (gross) | Below 20 000 € /y | 11 | 6 | 14 600 |
| 20 000 - 35 000 € /y | 18 | 16 | 38 800 | |
| 35 001 - 50 000 € /y | 19 | 21 | 50 900 | |
| 50 001 - 85 000 € /y | 21 | 27 | 65 500 | |
| 85 001 - 100 000 € /y | 8 | 9 | 21 800 | |
| Over 100 000 € /y | 10 | 14 | 34 000 | |
| Dont want to tell | 5 | 5 | 12 100 | |
| Cant say / No answer | 8 | 3 | 7 300 | |
| Family with kids | Yes | 32 | 29 | 70 300 |
| No | 68 | 71 | 172 200 | |
| 13 | 13 | 31 500 | ||
| 13 | 12 | 29 100 | ||
| 5 | 3 | 7 300 | ||
| 1 | 1 | 2 400 | ||
| 1 | 1 | 2 400 | ||
| 68 | 70 | 169 800 | ||
| 0 | 0 | 0 | ||
| Pets in household | Cat | 17 | 16 | 38 800 |
| Dog | 26 | 25 | 60 600 | |
| Some other pet | 5 | 5 | 12 100 | |
| No pets | 60 | 62 | 150 400 | |
| Health services used in the household | Public health services | 85 | 84 | 203 700 |
| Employer - funded health care services | 50 | 49 | 118 800 | |
| Private, self-funded healthcare services | 38 | 42 | 101 800 | |
| Private health insurance services | 24 | 22 | 53 400 | |
| No health care | 1 | 1 | 2 400 | |
| Can not say | 1 | 1 | 2 400 | |
| Housing | Apartment | 32 | 23 | 55 800 |
| Row house or semi-detached house | 15 | 15 | 36 400 | |
| Detached house | 47 | 56 | 135 800 | |
| Farm | 5 | 6 | 14 600 | |
| Something else | 1 | 1 | 2 400 | |
| Can not say | 0 | 0 | 0 | |
| Ownership of housing | Owner-occupied residence | 77 | 85 | 206 100 |
| Rented residence | 19 | 11 | 26 700 | |
| Right of residence apartment | 2 | 3 | 7 300 | |
| Something else | 1 | 1 | 2 400 | |
| Can not say | 1 | 0 | 0 | |
| Cottage or holiday home in regular use | Yes | 41 | 43 | 104 300 |
| No | 58 | 57 | 138 200 | |
| Can not say | 1 | 1 | 2 400 | |
| Number of cars in household | One car | 46 | 46 | 111 600 |
| Two cars | 31 | 35 | 84 900 | |
| Three or more cars | 10 | 12 | 29 100 | |
| No car | 14 | 7 | 17 000 | |
| Type of car, if buying now | New | 21 | 29 | 70 300 |
| Used | 68 | 68 | 164 900 | |
| Company car | 4 | 4 | 9 700 | |
| Leasing (personal) | 8 | 9 | 21 800 | |
| Shared car | 3 | 2 | 4 800 | |
| Doesn't use a car | 9 | 4 | 9 700 | |
| Can not say | 5 | 5 | 12 100 | |
| Advertising ban at the door / mailbox | Yes | 26 | 20 | 48 500 |
| No | 74 | 80 | 194 000 | |
| Can not say | 0 | 0 | 0 | |
| Using AdBlocker or similar application | Yes | 19 | 17 | 41 200 |
| No | 76 | 78 | 189 200 | |
| Can not say | 5 | 5 | 12 100 | |
| Type of municipality (7 class) | Greater Helsinki | 19 | 16 | 38 800 |
| Turku or Tampere | 8 | 6 | 14 600 | |
| Oulu | 4 | 3 | 7 300 | |
| 70 000 - 150 000 inhabitants town | 13 | 12 | 29 100 | |
| Urban municipality | 27 | 30 | 72 800 | |
| Conurbation | 15 | 20 | 48 500 | |
| Countryside | 13 | 14 | 34 000 | Source: NRS 2024 |
| How often different content is read | All 15+ % | Magazine Readers % | Amount of readers | |
|---|---|---|---|---|
| The frequency of reading: Print magazines | Daily | 14 | 22 | 53 400 |
| 5-6 days a week | 4 | 6 | 14 600 | |
| 1-4 days a week | 25 | 36 | 87 300 | |
| Monthly | 24 | 24 | 58 200 | |
| Rarely | 24 | 12 | 29 100 | |
| Never | 8 | 2 | 4 800 | |
| Can not say | 1 | 0 | 0 | |
| The frequency of reading: Magazine content in digital format | Daily | 22 | 27 | 65 500 |
| 5-6 days a week | 6 | 6 | 14 600 | |
| 1-4 days a week | 19 | 19 | 46 100 | |
| Monthly | 15 | 14 | 34 000 | |
| Rarely | 23 | 20 | 48 500 | |
| Never | 14 | 14 | 34 000 | |
| Can not say | 1 | 1 | 2 400 | |
| The frequency of reading: Print newspapers or afternoon papers | Daily | 28 | 39 | 94 600 |
| 5-6 days a week | 4 | 5 | 12 100 | |
| 1-4 days a week | 23 | 28 | 67 900 | |
| Monthly | 14 | 11 | 26 700 | |
| Rarely | 23 | 14 | 34 000 | |
| Never | 8 | 3 | 7 300 | |
| Can not say | 1 | 1 | 2 400 | |
| The frequency of reading: Newspaper or afternoon paper content in digital format | Daily | 54 | 61 | 147 900 |
| 5-6 days a week | 10 | 10 | 24 200 | |
| 1-4 days a week | 16 | 9 | 21 800 | |
| Monthly | 6 | 5 | 12 100 | |
| Rarely | 9 | 7 | 17 000 | |
| Never | 6 | 8 | 19 400 | |
| Can not say | 1 | 0 | 0 | |
| The frequency of reading: Free and free delivery newspapers | Daily | 5 | 6 | 14 600 |
| 5-6 days a week | 4 | 5 | 12 100 | |
| 1-4 days a week | 42 | 51 | 123 700 | |
| Monthly | 18 | 15 | 36 400 | |
| Rarely | 22 | 18 | 43 600 | |
| Never | 9 | 5 | 12 100 | |
| Can not say | 1 | 1 | 2 400 | |
| The frequency of watching: Free online TV services | Daily | 16 | 15 | 36 400 |
| 5-6 days a week | 10 | 11 | 26 700 | |
| 1-4 days a week | 30 | 32 | 77 600 | |
| Monthly | 23 | 22 | 53 400 | |
| Rarely | 14 | 14 | 34 000 | |
| Never | 6 | 6 | 14 600 | |
| Can not say | 1 | 1 | 2 400 | |
| The frequency of watching: Pay TV and streaming services | Daily | 15 | 13 | 31 500 |
| 5-6 days a week | 10 | 9 | 21 800 | |
| 1-4 days a week | 22 | 23 | 55 800 | |
| Monthly | 10 | 9 | 21 800 | |
| Rarely | 12 | 13 | 31 500 | |
| Never | 30 | 32 | 77 600 | |
| Can not say | 1 | 1 | 2 400 | |
| The frequency of watching: Programs of YLE (national broadcaster) TV channels | Daily | 44 | 54 | 131 000 |
| 5-6 days a week | 10 | 10 | 24 200 | |
| 1-4 days a week | 20 | 19 | 46 100 | |
| Monthly | 12 | 8 | 19 400 | |
| Rarely | 11 | 6 | 14 600 | |
| Never | 3 | 2 | 4 800 | |
| Can not say | 0 | 0 | 0 | |
| The frequency of watching: Programs of commercial TV channels | Daily | 34 | 43 | 104 300 |
| 5-6 days a week | 12 | 12 | 29 100 | |
| 1-4 days a week | 23 | 22 | 53 400 | |
| Monthly | 12 | 9 | 21 800 | |
| Rarely | 13 | 8 | 19 400 | |
| Never | 6 | 6 | 14 600 | |
| Can not say | 0 | 0 | 0 | |
| The frequency of listening: Programs of YLE (national broadcaster) radio-channels | Daily | 21 | 28 | 67 900 |
| 5-6 days a week | 7 | 10 | 24 200 | |
| 1-4 days a week | 16 | 18 | 43 600 | |
| Monthly | 13 | 14 | 34 000 | |
| Rarely | 26 | 21 | 50 900 | |
| Never | 16 | 10 | 24 200 | |
| Can not say | 1 | 1 | 2 400 | |
| The frequency of listening: Programs of commercial radio channels | Daily | 16 | 21 | 50 900 |
| 5-6 days a week | 9 | 11 | 26 700 | |
| 1-4 days a week | 22 | 25 | 60 600 | |
| Monthly | 14 | 12 | 29 100 | |
| Rarely | 22 | 18 | 43 600 | |
| Never | 16 | 13 | 31 500 | |
| Can not say | 1 | 0 | 0 | |
| The frequency of listening: Podcasts | Daily | 5 | 4 | 9 700 |
| 5-6 days a week | 3 | 3 | 7 300 | |
| 1-4 days a week | 10 | 10 | 24 200 | |
| Monthly | 14 | 11 | 26 700 | |
| Rarely | 29 | 27 | 65 500 | |
| Never | 38 | 44 | 106 700 | |
| Can not say | 2 | 2 | 4 800 | |
| User frequency and following: Social media | Daily | 59 | 47 | 114 000 |
| 5-6 days a week | 7 | 8 | 19 400 | |
| 1-4 days a week | 7 | 11 | 26 700 | |
| Monthly | 3 | 4 | 9 700 | |
| Rarely | 6 | 8 | 19 400 | |
| Never | 17 | 23 | 55 800 | |
| Can not say | 0 | 0 | 0 | |
| User frequency and following: Bloggers, YouTubers, or social media influencers | Daily | 13 | 7 | 17 000 |
| 5-6 days a week | 6 | 5 | 12 100 | |
| 1-4 days a week | 12 | 9 | 21 800 | |
| Monthly | 8 | 8 | 19 400 | |
| Rarely | 21 | 20 | 48 500 | |
| Never | 40 | 49 | 118 800 | |
| Can not say | 1 | 1 | 2 400 | |
| User frequency: Instant messaging | Daily | 69 | 62 | 150 400 |
| 5-6 days a week | 10 | 9 | 21 800 | |
| 1-4 days a week | 9 | 13 | 31 500 | |
| Monthly | 3 | 4 | 9 700 | |
| Rarely | 3 | 3 | 7 300 | |
| Never | 6 | 9 | 21 800 | |
| Can not say | 0 | 0 | 0 | |
| Daily | 16 | 14 | 34 000 | |
| 5-6 days a week | 6 | 6 | 14 600 | |
| 1-4 days a week | 14 | 13 | 31 500 | |
| Monthly | 22 | 23 | 55 800 | |
| Rarely | 35 | 35 | 84 900 | |
| Never | 7 | 7 | 17 000 | |
| Can not say | 0 | 1 | 2 400 | |
| Daily | 3 | 1 | 2 400 | |
| 5-6 days a week | 2 | 1 | 2 400 | |
| 1-4 days a week | 4 | 4 | 9 700 | |
| Monthly | 7 | 7 | 17 000 | |
| Rarely | 30 | 29 | 70 300 | |
| Never | 53 | 57 | 138 200 | |
| Can not say | 1 | 1 | 2 400 | |
| Daily | 6 | 4 | 9 700 | |
| 5-6 days a week | 3 | 2 | 4 800 | |
| 1-4 days a week | 5 | 5 | 12 100 | |
| Monthly | 8 | 6 | 14 600 | |
| Rarely | 23 | 23 | 55 800 | |
| Never | 55 | 61 | 147 900 | |
| Can not say | 1 | 1 | 2 400 | |
| Daily | 19 | 20 | 48 500 | |
| 5-6 days a week | 9 | 10 | 24 200 | |
| 1-4 days a week | 23 | 27 | 65 500 | |
| Monthly | 22 | 20 | 48 500 | |
| Rarely | 18 | 13 | 31 500 | |
| Never | 10 | 10 | 24 200 | |
| Can not say | 0 | 1 | 2 400 | |
| Daily | 4 | 6 | 14 600 | |
| 5-6 days a week | 2 | 3 | 7 300 | |
| 1-4 days a week | 7 | 9 | 21 800 | |
| Monthly | 7 | 6 | 14 600 | |
| Rarely | 12 | 12 | 29 100 | |
| Never | 61 | 56 | 135 800 | |
| Cant say / No answer | 7 | 8 | 19 400 | |
| Daily | 41 | 37 | 89 700 | |
| 5-6 days a week | 8 | 8 | 19 400 | |
| 1-4 days a week | 10 | 13 | 31 500 | |
| Monthly | 6 | 7 | 17 000 | |
| Rarely | 8 | 6 | 14 600 | |
| Never | 22 | 24 | 58 200 | |
| Cant say / No answer | 4 | 6 | 14 600 | |
| Daily | 31 | 21 | 50 900 | |
| 5-6 days a week | 6 | 6 | 14 600 | |
| 1-4 days a week | 9 | 10 | 24 200 | |
| Monthly | 5 | 6 | 14 600 | |
| Rarely | 10 | 10 | 24 200 | |
| Never | 34 | 41 | 99 400 | |
| Cant say / No answer | 5 | 6 | 14 600 | |
| Daily | 14 | 7 | 17 000 | |
| 5-6 days a week | 2 | 1 | 2 400 | |
| 1-4 days a week | 3 | 1 | 2 400 | |
| Monthly | 2 | 2 | 4 800 | |
| Rarely | 5 | 6 | 14 600 | |
| Never | 69 | 77 | 186 700 | |
| Cant say / No answer | 5 | 7 | 17 000 | |
| Daily | 6 | 9 | 21 800 | |
| 5-6 days a week | 2 | 3 | 7 300 | |
| 1-4 days a week | 5 | 4 | 9 700 | |
| Monthly | 5 | 5 | 12 100 | |
| Rarely | 12 | 12 | 29 100 | |
| Never | 65 | 61 | 147 900 | |
| Cant say / No answer | 5 | 6 | 14 600 | |
| Daily | 10 | 5 | 12 100 | |
| 5-6 days a week | 3 | 2 | 4 800 | |
| 1-4 days a week | 4 | 4 | 9 700 | |
| Monthly | 3 | 3 | 7 300 | |
| Rarely | 9 | 8 | 19 400 | |
| Never | 68 | 71 | 172 200 | |
| Cant say / No answer | 5 | 6 | 14 600 | Source: NRS 2024 |
| Consumer claims | All 15+ % | Magazine Readers % | Amount of readers | |
|---|---|---|---|---|
| I enjoy shopping | Completely agree | 13 | 9 | 21 800 |
| Partially agree | 44 | 43 | 104 300 | |
| Partially disagree | 31 | 37 | 89 700 | |
| Completely disagree | 10 | 10 | 24 200 | |
| Can not say | 2 | 1 | 2 400 | |
| I prefer domestic products | Completely agree | 32 | 32 | 77 600 |
| Partially agree | 55 | 55 | 133 400 | |
| Partially disagree | 10 | 11 | 26 700 | |
| Completely disagree | 1 | 1 | 2 400 | |
| Can not say | 1 | 1 | 2 400 | |
| I consciously make responsible choices in my consumption | Completely agree | 19 | 15 | 36 400 |
| Partially agree | 55 | 55 | 133 400 | |
| Partially disagree | 19 | 21 | 50 900 | |
| Completely disagree | 4 | 6 | 14 600 | |
| Can not say | 3 | 2 | 4 800 | |
| When shopping, quality is more important to me than price | Completely agree | 22 | 23 | 55 800 |
| Partially agree | 57 | 61 | 147 900 | |
| Partially disagree | 17 | 14 | 34 000 | |
| Completely disagree | 2 | 1 | 2 400 | |
| Can not say | 2 | 2 | 4 800 | |
| I usually choose the cheapest option | Completely agree | 12 | 9 | 21 800 |
| Partially agree | 47 | 48 | 116 400 | |
| Partially disagree | 34 | 36 | 87 300 | |
| Completely disagree | 6 | 6 | 14 600 | |
| Can not say | 1 | 1 | 2 400 | |
| I often take advantage of discount and campaign prices in my purchases | Completely agree | 37 | 33 | 80 000 |
| Partially agree | 51 | 54 | 131 000 | |
| Partially disagree | 9 | 9 | 21 800 | |
| Completely disagree | 2 | 2 | 4 800 | |
| Can not say | 1 | 1 | 2 400 | |
| In my circle of friends, I am often the first to try new things | Completely agree | 6 | 6 | 14 600 |
| Partially agree | 25 | 25 | 60 600 | |
| Partially disagree | 38 | 43 | 104 300 | |
| Completely disagree | 24 | 21 | 50 900 | |
| Can not say | 7 | 5 | 12 100 | |
| In my opinion, money is for consumption and not for saving | Completely agree | 5 | 5 | 12 100 |
| Partially agree | 35 | 38 | 92 200 | |
| Partially disagree | 46 | 46 | 111 600 | |
| Completely disagree | 11 | 9 | 21 800 | |
| Can not say | 3 | 2 | 4 800 | |
| I prefer local shops and services | Completely agree | 27 | 27 | 65 500 |
| Partially agree | 57 | 58 | 140 600 | |
| Partially disagree | 12 | 13 | 31 500 | |
| Completely disagree | 2 | 1 | 2 400 | |
| Can not say | 2 | 1 | 2 400 | |
| I want to see advertising targeted to me based on my online behavior | Completely agree | 4 | 3 | 7 300 |
| Partially agree | 28 | 26 | 63 000 | |
| Partially disagree | 31 | 33 | 80 000 | |
| Completely disagree | 32 | 34 | 82 400 | |
| Can not say | 5 | 4 | 9 700 | |
| When I want a certain brand of product, the price doesn't matter | Completely agree | 9 | 9 | 21 800 |
| Partially agree | 32 | 35 | 84 900 | |
| Partially disagree | 37 | 36 | 87 300 | |
| Completely disagree | 22 | 19 | 46 100 | |
| Can not say | 2 | 1 | 2 400 | |
| I prefer certified products in my purchases (e.g. Fairtrade, The Nordic Swan Ecolabel, Avainlippu) | Completely agree | 17 | 11 | 26 700 |
| Partially agree | 50 | 52 | 126 100 | |
| Partially disagree | 24 | 27 | 65 500 | |
| Completely disagree | 6 | 8 | 19 400 | |
| Can not say | 3 | 2 | 4 800 | |
| Ecology is an important purchase reason for me | Completely agree | 16 | 11 | 26 700 |
| Partially agree | 51 | 50 | 121 200 | |
| Partially disagree | 24 | 28 | 67 900 | |
| Completely disagree | 7 | 9 | 21 800 | |
| Can not say | 3 | 2 | 4 800 | |
| I prefer well-known brands | Completely agree | 12 | 12 | 29 100 |
| Partially agree | 57 | 61 | 147 900 | |
| Partially disagree | 23 | 22 | 53 400 | |
| Completely disagree | 5 | 4 | 9 700 | |
| Can not say | 3 | 2 | 4 800 | Source: NRS 2024 |
| Attitude towards advertising in different media channels | All 15+ % | Magazine Readers % | Amount of readers | |
|---|---|---|---|---|
| Newspapers | Very positive | 13 | 12 | 29 100 |
| Quite positively | 63 | 66 | 160 000 | |
| Quite negatively | 15 | 15 | 36 400 | |
| Very negative | 4 | 3 | 7 300 | |
| Can not say | 5 | 4 | 9 700 | |
| Magazines | Very positive | 14 | 13 | 31 500 |
| Quite positively | 61 | 64 | 155 200 | |
| Quite negatively | 16 | 15 | 36 400 | |
| Very negative | 4 | 4 | 9 700 | |
| Can not say | 6 | 4 | 9 700 | |
| Free and local newspapers | Very positive | 24 | 23 | 55 800 |
| Quite positively | 57 | 62 | 150 400 | |
| Quite negatively | 10 | 9 | 21 800 | |
| Very negative | 3 | 3 | 7 300 | |
| Can not say | 5 | 4 | 9 700 | |
| Newspaper/Magazine websites or applications | Very positive | 7 | 6 | 14 600 |
| Quite positively | 47 | 49 | 118 800 | |
| Quite negatively | 28 | 28 | 67 900 | |
| Very negative | 9 | 10 | 24 200 | |
| Can not say | 8 | 8 | 19 400 | |
| Social media (Facebook, Instagram etc.) | Very positive | 6 | 4 | 9 700 |
| Quite positively | 34 | 33 | 80 000 | |
| Quite negatively | 32 | 33 | 80 000 | |
| Very negative | 16 | 16 | 38 800 | |
| Can not say | 13 | 14 | 34 000 | |
| Blogs | Very positive | 4 | 2 | 4 800 |
| Quite positively | 27 | 25 | 60 600 | |
| Quite negatively | 28 | 27 | 65 500 | |
| Very negative | 15 | 18 | 43 600 | |
| Can not say | 27 | 29 | 70 300 | |
| Newsletters to email | Very positive | 2 | 1 | 2 400 |
| Quite positively | 18 | 16 | 38 800 | |
| Quite negatively | 34 | 35 | 84 900 | |
| Very negative | 43 | 45 | 109 100 | |
| Can not say | 3 | 4 | 9 700 | |
| Other websites | Very positive | 4 | 3 | 7 300 |
| Quite positively | 39 | 39 | 94 600 | |
| Quite negatively | 33 | 34 | 82 400 | |
| Very negative | 13 | 13 | 31 500 | |
| Can not say | 11 | 11 | 26 700 | |
| Commercial TV channels (MTV3, Nelonen, Sub, FOX etc.) | Very positive | 9 | 8 | 19 400 |
| Quite positively | 48 | 51 | 123 700 | |
| Quite negatively | 28 | 27 | 65 500 | |
| Very negative | 13 | 11 | 26 700 | |
| Can not say | 4 | 3 | 7 300 | |
| Commercial radio channels (Radio Nova, SuomiPOP, NRJ, Iskelmä etc.) | Very positive | 5 | 5 | 12 100 |
| Quite positively | 36 | 39 | 94 600 | |
| Quite negatively | 33 | 32 | 77 600 | |
| Very negative | 19 | 19 | 46 100 | |
| Can not say | 6 | 5 | 12 100 | |
| Home delivered advertisements and catalogues | Very positive | 20 | 19 | 46 100 |
| Quite positively | 47 | 52 | 126 100 | |
| Quite negatively | 16 | 14 | 34 000 | |
| Very negative | 13 | 12 | 29 100 | |
| Can not say | 4 | 3 | 7 300 | |
| Out-of-home advertising | Very positive | 12 | 11 | 26 700 |
| Quite positively | 53 | 55 | 133 400 | |
| Quite negatively | 20 | 22 | 53 400 | |
| Very negative | 7 | 7 | 17 000 | |
| Can not say | 7 | 5 | 12 100 | Source: NRS 2024 |
| Reading device and advertising effect | All 15+ % | Magazine Readers % | Amount of readers | |
|---|---|---|---|---|
| I relax and get inspired by magazines | Completely agree | 17 | 16 | 38 800 |
| Partially agree | 61 | 64 | 155 200 | |
| Partially disagree | 11 | 11 | 26 700 | |
| Completely disagree | 4 | 3 | 7 300 | |
| Can not say | 7 | 5 | 12 100 | |
| Completely agree | 17 | 14 | 34 000 | |
| Partially agree | 58 | 60 | 145 500 | |
| Partially disagree | 14 | 17 | 41 200 | |
| Completely disagree | 5 | 4 | 9 700 | |
| Can not say | 7 | 5 | 12 100 | |
| A professional magazine keeps me up to date on professional matters | Completely agree | 22 | 27 | 65 500 |
| Partially agree | 48 | 49 | 118 800 | |
| Partially disagree | 12 | 10 | 24 200 | |
| Completely disagree | 5 | 4 | 9 700 | |
| Can not say | 13 | 10 | 24 200 | |
| The industry specialty magazine provides information on my hobbies and interests | Completely agree | 31 | 38 | 92 200 |
| Partially agree | 50 | 49 | 118 800 | |
| Partially disagree | 7 | 6 | 14 600 | |
| Completely disagree | 3 | 2 | 4 800 | |
| Can not say | 9 | 6 | 14 600 | |
| Finnish magazines offer reliable comparisons and tests | Completely agree | 16 | 21 | 50 900 |
| Partially agree | 52 | 57 | 138 200 | |
| Partially disagree | 14 | 12 | 29 100 | |
| Completely disagree | 3 | 2 | 4 800 | |
| Can not say | 15 | 8 | 19 400 | |
| Finnish magazines offer reliable product recommendations | Completely agree | 10 | 11 | 26 700 |
| Partially agree | 54 | 57 | 138 200 | |
| Partially disagree | 18 | 19 | 46 100 | |
| Completely disagree | 3 | 2 | 4 800 | |
| Can not say | 15 | 10 | 24 200 | |
| Finnish magazines are of high quality | Completely agree | 22 | 24 | 58 200 |
| Partially agree | 59 | 60 | 145 500 | |
| Partially disagree | 9 | 10 | 24 200 | |
| Completely disagree | 2 | 1 | 2 400 | |
| Can not say | 8 | 5 | 12 100 | |
| I follow important magazines on social media | Completely agree | 7 | 6 | 14 600 |
| Partially agree | 25 | 24 | 58 200 | |
| Partially disagree | 25 | 27 | 65 500 | |
| Completely disagree | 34 | 36 | 87 300 | |
| Can not say | 9 | 7 | 17 000 | |
| I read important magazines from cover to cover | Completely agree | 18 | 21 | 50 900 |
| Partially agree | 34 | 36 | 87 300 | |
| Partially disagree | 28 | 29 | 70 300 | |
| Completely disagree | 16 | 11 | 26 700 | |
| Can not say | 5 | 4 | 9 700 | |
| Ads in magazines make new things familiar | Completely agree | 10 | 11 | 26 700 |
| Partially agree | 50 | 52 | 126 100 | |
| Partially disagree | 24 | 25 | 60 600 | |
| Completely disagree | 8 | 7 | 17 000 | |
| Can not say | 8 | 6 | 14 600 | |
| Completely agree | 10 | 10 | 24 200 | |
| Partially agree | 36 | 39 | 94 600 | |
| Partially disagree | 24 | 23 | 55 800 | |
| Completely disagree | 23 | 20 | 48 500 | |
| Can not say | 8 | 8 | 19 400 | |
| I have purchased products based on the ad in magazine | Completely agree | 9 | 10 | 24 200 |
| Partially agree | 36 | 35 | 84 900 | |
| Partially disagree | 26 | 29 | 70 300 | |
| Completely disagree | 22 | 20 | 48 500 | |
| Can not say | 6 | 6 | 14 600 | |
| I'm trying out tips or guidelines (like recipes) in magazine ads | Completely agree | 13 | 11 | 26 700 |
| Partially agree | 49 | 43 | 104 300 | |
| Partially disagree | 20 | 27 | 65 500 | |
| Completely disagree | 13 | 14 | 34 000 | |
| Can not say | 5 | 5 | 12 100 | |
| I'm experimenting with product samples in magazines (like food or cosmetics) | Completely agree | 9 | 5 | 12 100 |
| Partially agree | 29 | 25 | 60 600 | |
| Partially disagree | 29 | 32 | 77 600 | |
| Completely disagree | 27 | 33 | 80 000 | |
| Can not say | 6 | 5 | 12 100 | |
| Completely agree | 2 | 1 | 2 400 | |
| Partially agree | 19 | 14 | 34 000 | |
| Partially disagree | 33 | 30 | 72 800 | |
| Completely disagree | 38 | 47 | 114 000 | |
| Can not say | 9 | 8 | 19 400 | |
| Completely agree | 16 | 12 | 29 100 | |
| Partially agree | 40 | 44 | 106 700 | |
| Partially disagree | 23 | 26 | 63 000 | |
| Completely disagree | 12 | 13 | 31 500 | |
| Can not say | 8 | 5 | 12 100 | Source: NRS 2024 |
| Use of information sources during the purchase process | All 15+ % | Magazine Readers % | Amount of readers | |
|---|---|---|---|---|
| Information sources, cars and car purchase | Print magazines | 11 | 21 | 50 900 |
| Newspapers | 13 | 18 | 43 600 | |
| Magazine websites | 7 | 11 | 26 700 | |
| Newspaper websites | 8 | 10 | 24 200 | |
| Blogs | 3 | 3 | 7 300 | |
| Social media | 14 | 13 | 31 500 | |
| Other websites | 42 | 53 | 128 500 | |
| Television | 10 | 13 | 31 500 | |
| Radio | 2 | 2 | 4 800 | |
| Direct mail | 10 | 14 | 34 000 | |
| None of these | 40 | 26 | 63 000 | |
| Information sources, consumer electronics and information technology | Print magazines | 15 | 21 | 50 900 |
| Newspapers | 18 | 21 | 50 900 | |
| Magazine websites | 10 | 12 | 29 100 | |
| Newspaper websites | 11 | 12 | 29 100 | |
| Blogs | 6 | 5 | 12 100 | |
| Social media | 26 | 22 | 53 400 | |
| Other websites | 49 | 53 | 128 500 | |
| Television | 17 | 20 | 48 500 | |
| Radio | 3 | 3 | 7 300 | |
| Direct mail | 36 | 42 | 101 800 | |
| None of these | 17 | 13 | 31 500 | |
| Information sources, beauty care and cosmetics | Print magazines | 18 | 13 | 31 500 |
| Newspapers | 8 | 8 | 19 400 | |
| Magazine websites | 10 | 5 | 12 100 | |
| Newspaper websites | 6 | 4 | 9 700 | |
| Blogs | 8 | 3 | 7 300 | |
| Social media | 28 | 12 | 29 100 | |
| Other websites | 16 | 13 | 31 500 | |
| Television | 14 | 14 | 34 000 | |
| Radio | 2 | 3 | 7 300 | |
| Direct mail | 17 | 16 | 38 800 | |
| None of these | 45 | 58 | 140 600 | |
| Information sources, travel | Print magazines | 16 | 20 | 48 500 |
| Newspapers | 15 | 18 | 43 600 | |
| Magazine websites | 10 | 10 | 24 200 | |
| Newspaper websites | 10 | 9 | 21 800 | |
| Blogs | 11 | 9 | 21 800 | |
| Social media | 34 | 25 | 60 600 | |
| Other websites | 47 | 51 | 123 700 | |
| Television | 16 | 19 | 46 100 | |
| Radio | 3 | 4 | 9 700 | |
| Direct mail | 9 | 14 | 34 000 | |
| None of these | 27 | 23 | 55 800 | |
| Information sources, style and fashion | Print magazines | 23 | 20 | 48 500 |
| Newspapers | 13 | 16 | 38 800 | |
| Magazine websites | 13 | 9 | 21 800 | |
| Newspaper websites | 8 | 9 | 21 800 | |
| Blogs | 9 | 4 | 9 700 | |
| Social media | 34 | 20 | 48 500 | |
| Other websites | 33 | 31 | 75 200 | |
| Television | 18 | 18 | 43 600 | |
| Radio | 2 | 2 | 4 800 | |
| Direct mail | 25 | 27 | 65 500 | |
| None of these | 29 | 35 | 84 900 | |
| Information sources, building and renovating | Print magazines | 19 | 23 | 55 800 |
| Newspapers | 15 | 21 | 50 900 | |
| Magazine websites | 9 | 11 | 26 700 | |
| Newspaper websites | 8 | 11 | 26 700 | |
| Blogs | 6 | 4 | 9 700 | |
| Social media | 23 | 17 | 41 200 | |
| Other websites | 32 | 39 | 94 600 | |
| Television | 18 | 20 | 48 500 | |
| Radio | 2 | 2 | 4 800 | |
| Direct mail | 27 | 34 | 82 400 | |
| None of these | 33 | 24 | 58 200 | |
| Information sources, food, cooking and baking | Print magazines | 36 | 36 | 87 300 |
| Newspapers | 26 | 29 | 70 300 | |
| Magazine websites | 22 | 17 | 41 200 | |
| Newspaper websites | 20 | 19 | 46 100 | |
| Blogs | 14 | 8 | 19 400 | |
| Social media | 42 | 31 | 75 200 | |
| Other websites | 33 | 33 | 80 000 | |
| Television | 28 | 33 | 80 000 | |
| Radio | 6 | 8 | 19 400 | |
| Direct mail | 27 | 31 | 75 200 | |
| None of these | 12 | 14 | 34 000 | |
| Information sources, eyeglasses, contact lenses or sunglasses | Print magazines | 7 | 9 | 21 800 |
| Newspapers | 11 | 12 | 29 100 | |
| Magazine websites | 3 | 4 | 9 700 | |
| Newspaper websites | 6 | 5 | 12 100 | |
| Blogs | 1 | 1 | 2 400 | |
| Social media | 10 | 8 | 19 400 | |
| Other websites | 25 | 26 | 63 000 | |
| Television | 12 | 15 | 36 400 | |
| Radio | 2 | 2 | 4 800 | |
| Direct mail | 17 | 20 | 48 500 | |
| None of these | 52 | 49 | 118 800 | |
| Information sources, decorating and furniture purchases | Print magazines | 23 | 23 | 55 800 |
| Newspapers | 16 | 22 | 53 400 | |
| Magazine websites | 11 | 10 | 24 200 | |
| Newspaper websites | 8 | 9 | 21 800 | |
| Blogs | 8 | 5 | 12 100 | |
| Social media | 28 | 17 | 41 200 | |
| Other websites | 30 | 31 | 75 200 | |
| Television | 18 | 19 | 46 100 | |
| Radio | 2 | 2 | 4 800 | |
| Direct mail | 30 | 33 | 80 000 | |
| None of these | 26 | 26 | 63 000 | |
| Information sources, saving and investing | Print magazines | 9 | 14 | 34 000 |
| Newspapers | 11 | 13 | 31 500 | |
| Magazine websites | 7 | 8 | 19 400 | |
| Newspaper websites | 10 | 9 | 21 800 | |
| Blogs | 7 | 6 | 14 600 | |
| Social media | 18 | 13 | 31 500 | |
| Other websites | 30 | 35 | 84 900 | |
| Television | 7 | 11 | 26 700 | |
| Radio | 3 | 3 | 7 300 | |
| Direct mail | 4 | 5 | 12 100 | |
| None of these | 48 | 42 | 101 800 | |
| Information sources, health and wellbeing products / services | Print magazines | 14 | 15 | 36 400 |
| Newspapers | 14 | 16 | 38 800 | |
| Magazine websites | 8 | 7 | 17 000 | |
| Newspaper websites | 8 | 7 | 17 000 | |
| Blogs | 5 | 4 | 9 700 | |
| Social media | 23 | 15 | 36 400 | |
| Other websites | 38 | 37 | 89 700 | |
| Television | 12 | 13 | 31 500 | |
| Radio | 3 | 3 | 7 300 | |
| Direct mail | 16 | 18 | 43 600 | |
| None of these | 37 | 39 | 94 600 | |
| Information sources, purchase of sportswear, -footwear or -equipment | Print magazines | 12 | 15 | 36 400 |
| Newspapers | 18 | 21 | 50 900 | |
| Magazine websites | 7 | 8 | 19 400 | |
| Newspaper websites | 9 | 10 | 24 200 | |
| Blogs | 5 | 3 | 7 300 | |
| Social media | 24 | 17 | 41 200 | |
| Other websites | 41 | 41 | 99 400 | |
| Television | 14 | 16 | 38 800 | |
| Radio | 2 | 2 | 4 800 | |
| Direct mail | 30 | 35 | 84 900 | |
| None of these | 29 | 28 | 67 900 | Source: NRS 2024 |
| Buyer profile | All 15+ % | Magazine Readers % | Amount of readers | |
|---|---|---|---|---|
| Interests | Cars, motor vehicles | 26 | 63 | 152 800 |
| Well-being and health | 52 | 41 | 99 400 | |
| Charity work | 14 | 9 | 21 800 | |
| Self development | 32 | 25 | 60 600 | |
| Celebrities | 15 | 7 | 17 000 | |
| Fishing | 16 | 19 | 46 100 | |
| Beauty care and cosmetics | 17 | 4 | 9 700 | |
| Literature | 27 | 19 | 46 100 | |
| Domestic and foreign news | 54 | 59 | 143 100 | |
| Domestic travel | 32 | 34 | 82 400 | |
| Culture | 33 | 20 | 48 500 | |
| Crafts | 26 | 14 | 34 000 | |
| Nature and going outdoor | 53 | 50 | 121 200 | |
| Hunting | 10 | 14 | 34 000 | |
| Style and fashion | 22 | 8 | 19 400 | |
| Music and concerts | 37 | 25 | 60 600 | |
| Going on summer cottage | 30 | 34 | 82 400 | |
| Local affairs | 56 | 60 | 145 500 | |
| Computer/console/mobile playing | 17 | 13 | 31 500 | |
| Politics | 41 | 46 | 111 600 | |
| Gardening and plants | 33 | 27 | 65 500 | |
| Building and renovating | 37 | 54 | 131 000 | |
| Food and drink | 40 | 34 | 82 400 | |
| Cooking, baking, recipes | 39 | 26 | 63 000 | |
| Investment | 22 | 22 | 53 400 | |
| Decorating | 30 | 14 | 34 000 | |
| Economic and finances | 35 | 44 | 106 700 | |
| Science | 34 | 35 | 84 900 | |
| Travelling abroad | 35 | 32 | 77 600 | |
| Sports, exercising | 46 | 48 | 116 400 | |
| Sailing, boating | 10 | 15 | 36 400 | |
| Consumer electronics and information technology | 23 | 34 | 82 400 | |
| Environmental matters | 32 | 26 | 63 000 | |
| None of the above | 0 | 0 | 0 | |
| Purchases made and planned | ||||
| Planned acquisitions in the househould over the next 2 years | Building a house | 2 | 3 | 7 300 |
| Buying an apartment | 10 | 8 | 19 400 | |
| Home renovation | 29 | 33 | 80 000 | |
| Buying a car | 25 | 29 | 70 300 | |
| Buying a boat | 3 | 4 | 9 700 | |
| None of these | 50 | 45 | 109 100 | |
| Purchases in the last 12 months | Furniture and furnishings | 42 | 40 | 97 000 |
| Repair and construction products | 40 | 50 | 121 200 | |
| Domestic appliances | 38 | 44 | 106 700 | |
| Electronics or IT products | 49 | 57 | 138 200 | |
| Cars | 18 | 21 | 50 900 | |
| Clothing and footwear | 82 | 78 | 189 200 | |
| Eyeglasses, contact lenses or sunglasses | 35 | 35 | 84 900 | |
| Sports clothing, footwear or equipment | 60 | 57 | 138 200 | |
| Saving or investing products or services | 26 | 29 | 70 300 | |
| Cosmetics and beauty products | 47 | 30 | 72 800 | |
| Mobile phones | 30 | 31 | 75 200 | |
| Travels | 46 | 46 | 111 600 | |
| Products and services for health and well-being | 60 | 51 | 123 700 | |
| None of the above | 2 | 2 | 4 800 | |
| Intentions to purchase within 12 months | Furniture and furnishings | 29 | 25 | 60 600 |
| Repair and construction products | 34 | 44 | 106 700 | |
| Domestic appliances | 19 | 18 | 43 600 | |
| Electronics or IT products | 28 | 32 | 77 600 | |
| Cars | 14 | 17 | 41 200 | |
| Clothing and footwear | 64 | 57 | 138 200 | |
| Eyeglasses, contact lenses or sunglasses | 28 | 27 | 65 500 | |
| Sports clothing, footwear or equipment | 43 | 44 | 106 700 | |
| Saving or investing products or services | 21 | 21 | 50 900 | |
| Cosmetics and beauty products | 38 | 21 | 50 900 | |
| Mobile phones | 16 | 17 | 41 200 | |
| Travels | 44 | 46 | 111 600 | |
| Products and services for health and well-being | 48 | 39 | 94 600 | |
| None of the above | 7 | 8 | 19 400 | |
| Will consider switching over the next 12 months | Bank | 7 | 8 | 19 400 |
| Insurance company | 10 | 12 | 29 100 | |
| electric company | 20 | 26 | 63 000 | |
| Internet Connection | 9 | 10 | 24 200 | |
| Phone-subscription | 13 | 14 | 34 000 | |
| None of the above | 46 | 44 | 106 700 | |
| Can not say | 19 | 17 | 41 200 | |
| Uses of extra money | Magazines, books, movies | 17 | 15 | 36 400 |
| Eating, drinking, partying in a restaurant | 34 | 30 | 72 800 | |
| Exercise hobbies and equipment | 27 | 27 | 65 500 | |
| Cultural events (e.g. concerts, theater, festivals) | 35 | 29 | 70 300 | |
| Renovation, decoration | 24 | 26 | 63 000 | |
| Health services and one's own well-being | 22 | 17 | 41 200 | |
| Travelling | 42 | 46 | 111 600 | |
| Entertainment electronics and information technology equipment, mobile phones | 15 | 20 | 48 500 | |
| Clothes, shoes and bags | 23 | 16 | 38 800 | |
| Home services (cleaning and other housekeeping services) | 6 | 4 | 9 700 | |
| Car, boat, motorcycle | 12 | 21 | 50 900 | |
| Cosmetics and beauty care | 11 | 3 | 7 300 | |
| Saving, investing | 46 | 48 | 116 400 | |
| Other | 8 | 9 | 21 800 | |
| There is no extra money after mandatory expenses | 7 | 5 | 12 100 | |
| Can not say | 3 | 4 | 9 700 | Source: NRS 2024 |
Online & social media
Magazine website
Magazine in Social Media
Some channels and Followers December 2024
Contact info
Media sales
- Autoliitto ry
- Hämeentie 105 A 4.krs
- 00550 Helsinki
- www.autoliitto.fi
Media-assistentti
- Sini Mäkelä
- 050 527 0201
- sini.makela@moottori.fi
Mediamyynti
- Jari Istolainen
- 040 504 4970
- jari.istolainen@moottori.fi
Media
Publisher
- Autoliitto ry
Publisher
- Autoliitto ry
Päätoimittaja
- Eila Parviainen
Address
- Hämeentie 105 A
- 00550 Helsinki
Postal address
- Hämeentie 105 A
- 00550 Helsinki
- toimitus@moottori.fi